The Research Alliance’s Spotlight on NYC Schools series offers short, digestible data analyses and visualizations designed to inform dialogue about education in New York City. We hope Spotlight posts serve as conversation starters, stoke interest in rigorous education research, and encourage readers to think about how data and evidence might be brought to bear on important issues in the City.
Equity Indicators: Middle School Opportunities
This spotlight examines differences in middle school opportunities across NYC, focusing on access to accelerated coursework, the use of suspensions, and supportive school climate, including interactive graphics that reveal disparities associated with race/ethnicity, neighborhood income, IEP status, English Learner status, and gender.
Equity Indicators: Middle School Outcomes
This post focuses on equity in middle school outcomes, including differences by race/ethnicity, neighborhood income, IEP status, English Learner status, and gender. Outcomes examined include students' attendance, grades, test scores, and suspension rates.
Equity Indicators: High School Outcomes
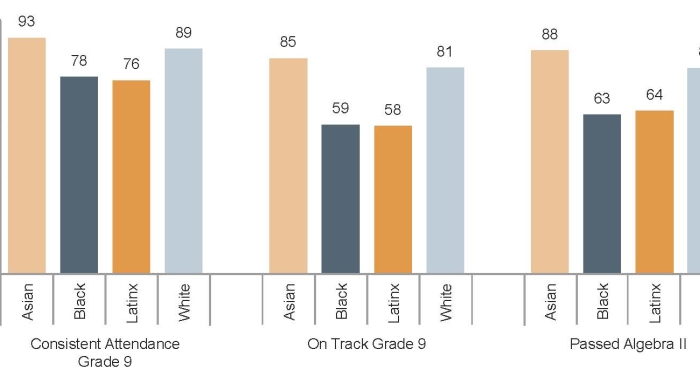
This post starts with a discussion of the reasons why it is important to monitor educational equity. Interactive graphs provide a look at attendance, on-track rates, graduation, and college enrollment for students with different background characteristics.
Equity Indicators: High School Opportunities
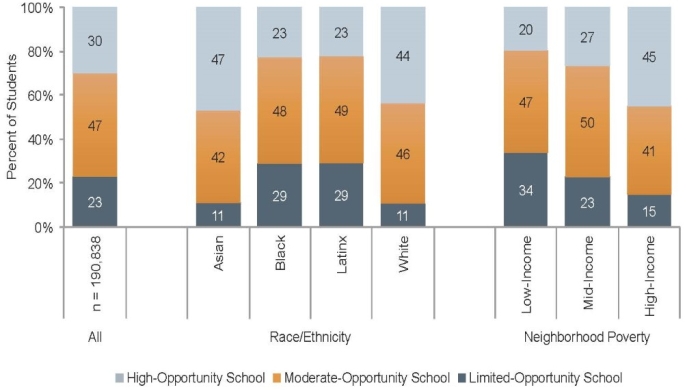
To what extent do NYC high school students have equal access to educational opportunities? Our latest post examines differences between high schools that may curtail or support opportunities. The analysis reveals significant disparities in the availability of advanced coursework, non-exclusionary discipline, and supportive learning environments.
CTE Innovation and Impact: Learning from New York City
The Research Alliance is conducting a multi-year, multi-component study of Career and Technical Education programs in New York City. Our latest Spotlight post highlights key findings to date.
Do “Bridging the Gap” Social Workers Improve Attendance for Students Experiencing Homelessness?
Each year, more than 100,000 NYC students are identified as homeless. The Bridging the Gap program was launched in 2017 to help schools better support these vulnerable young people.
What Are the Characteristics of Predominantly Black “Inclusive Discipline” Schools in New York City?
In this Spotlight post, we begin to explore NYC schools that have “beaten the odds” when it comes to student discipline.
Peer Continuity from Middle to High School
This Spotlight post looks at peer continuity in several ways, including the percentage of students who were the only person from their 8th grade class to attend their high school—and how this varies by race/ethnicity and neighborhood poverty.
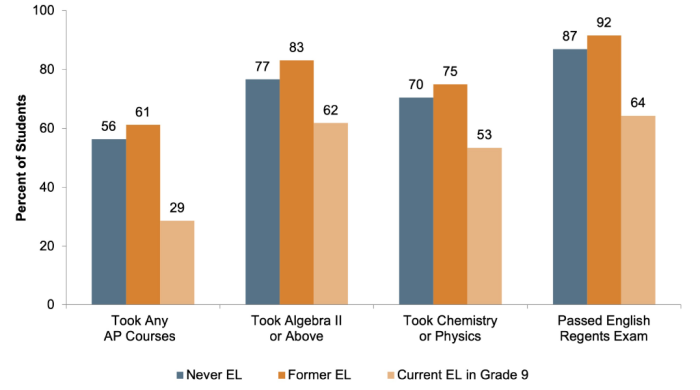
What do we know about equitable access and outcomes for English Learners in New York City?
The sixth post in our ongoing series considers several indicators of access and opportunity for students as they move through high school.
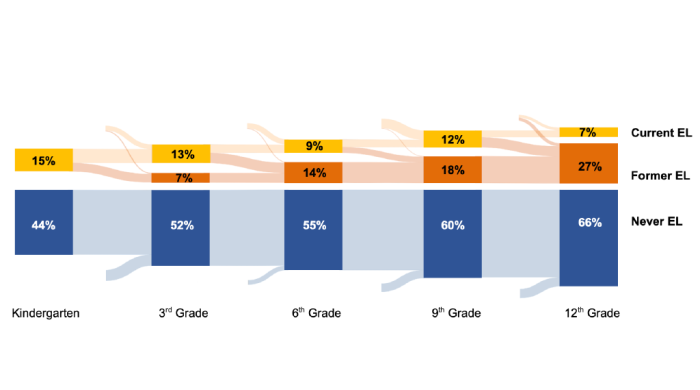
How should we think about equity for English Learners in New York City?
This fifth post in our ongoing series on equity indicators turns to English learners, who represent a growing and increasingly diverse portion of the City’s student population.
How Equitable is Access to a Positive School Climate in NYC Schools? Part 2
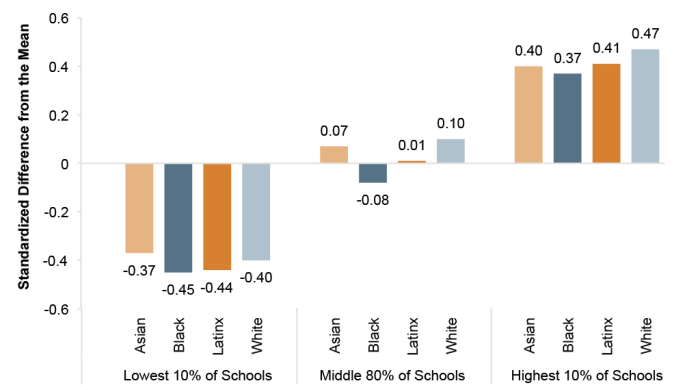
The fourth post in our ongoing series focuses on high schools with the highest and lowest average perceptions of climate, based on the composite measure that we introduced in our previous post.
How Equitable is Access to a Positive School Climate in NYC Schools?
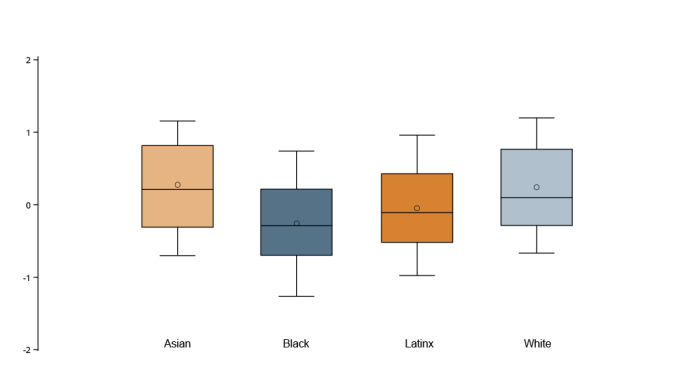
The third post in our series examines how school-wide perceptions of school climate vary by race/ethnicity, finding that Black students, in particular, appear to attend schools with climates that are rated lower on average.
Access to Advanced Coursework in NYC High Schools
The second post in our series examines the degree to which students in NYC have had opportunities to take classes that would help them graduate from high school and prepare for post-secondary education, exploring how access to advanced coursework varies by race/ethnicity and neighborhood poverty.
Introducing the Indicators of Education Equity Project
The first in a regular series exploring indicators of equity in NYC schools, this post examines differences in academic engagement and progress in high school and highlights important questions about the factors driving these disparities.
To What Extent Are Students With Disabilities Included in K-12 Computer Science Education?
This Spotlight post uses data on students’ Individualized Education Plans and course enrollment records from the 2018-2019 school year to explore the degree to which students with disabilities are participating in CS.
Who is Taking Computer Science in New York City Schools?
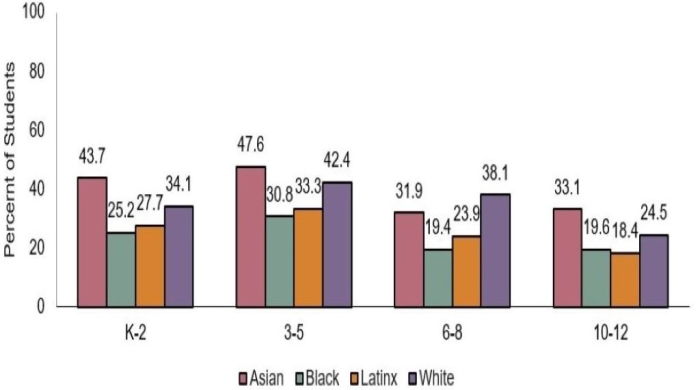
This Spotlight post uses data from the 2016-2017 through 2018-2019 school years to explore NYC students’ participation in CS across grade bands. We focus here on differences associated with race and ethnicity, gender, and socioeconomic status.
Who Chooses Career and Technical Education in NYC?
While CTE has been the focus of increased attention and investment in recent years, we know relatively little about student “demand” for CTE. Which students are interested in and applying to CTE programs? And how are these students different (if at all) from those who prefer more traditional high school options?
How Has the Supply of Career and Technical Education Changed Over Time in NYC?
This Spotlight post describes the landscape of CTE programs in NYC during the last decade—including the number of programs being offered, the proportion of programs in CTE-dedicated versus traditional academic high schools, and the representation of various career themes.
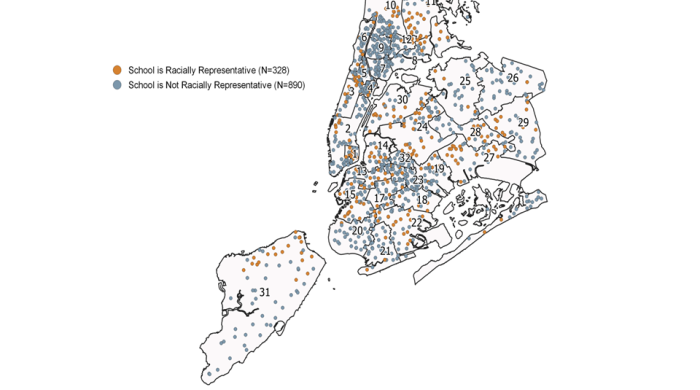
Mapping Racially Representative Schools
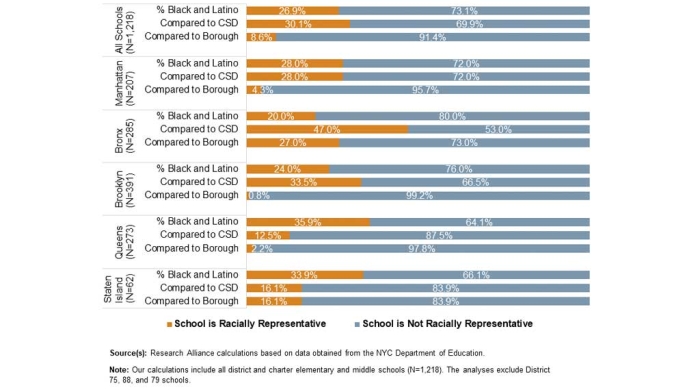
In our last Spotlight post, we showed how different definitions of “racial representation” provide very different pictures of segregation across NYC. In this post, we use maps to show where racially representative schools are located.
Which Schools Are "Racially Representative?" It Depends on the Definition You Use
The New York City public school population is one of the most racially and ethnically diverse in the country. Yet the entrenched racial and socio-economic segregation of City schools has been the object of increasing attention. During the last two years, the NYC DOE has made fostering school diversity—broadly defined—a central pillar of its agenda.
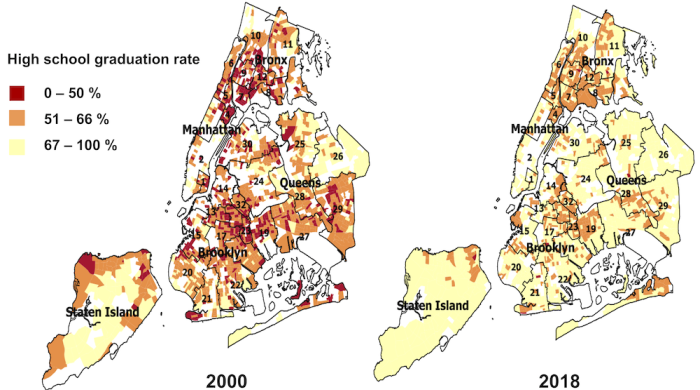
How Have Links Between Neighborhood Poverty and Education Outcomes Changed Over Time?
This post examines the relationship between students’ outcomes and the area of the City in which they live—and whether this relationship has changed over time.
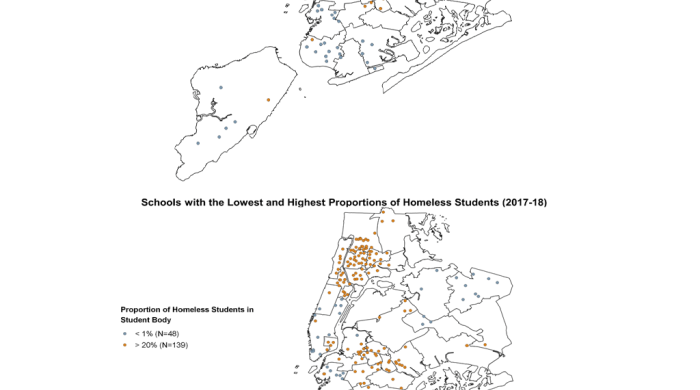
Where Are NYC Schools Serving the Highest Concentrations of Homeless Students?
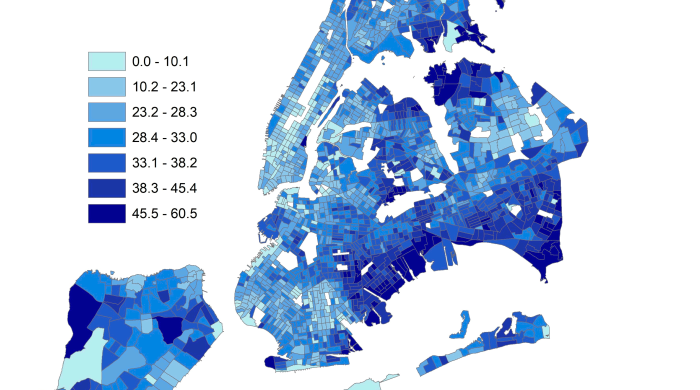
Students experiencing homelessness are not evenly distributed across the system. Although most elementary schools in the City serve some homeless students, the percentages ranged from less than 1 percent to 40 percent (or more) of the student population.
How Have ELA and Math Achievement Levels Changed Over Time?
As part of a series examining progress and disparities in NYC schools, this Spotlight post focuses on trends over time in the standardized test scores of elementary and middle school students.
How Has Attendance in NYC Schools Changed Over Time?
This post explores trends in attendance and chronic absenteeism between 2000 and 2018, including differences associated with race/ethnicity and neighborhood poverty.
How Have NYC’s High School Graduation and College Enrollment Rates Changed Over Time?
This post focuses on trends in high school graduation and college enrollment, highlighting both notable improvements and persistent disparities linked to race/ethnicity and neighborhood income.
How Have Key Student Outcomes Changed in NYC Schools?
This post is an introduction to a series of Spotlights exploring how key student outcomes have changed during the last two decades.
How Do Elementary-Aged Students in New York City Experience Homelessness?
This post examines the proportion of homeless students—during the 2012-2013 and 2016-2017 school years—who experienced different types of homelessness (in shelter, doubled up, or other).
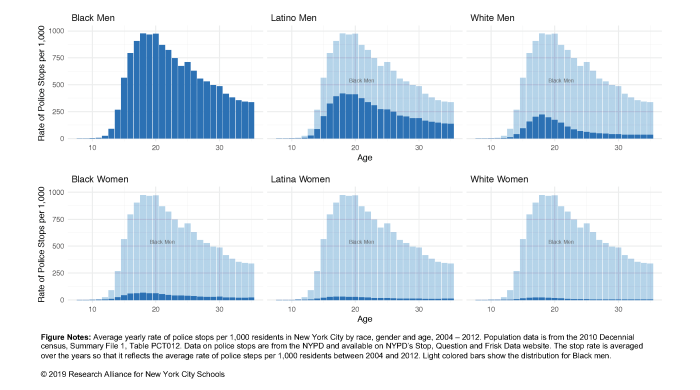
Police Exposure Among School-Aged Youth in New York City
Over the last few decades, cities across the United States have adopted proactive or broken windows policing strategies. As a consequence of these changes, an increasing number of minority youth are in contact with the criminal justice system. In New York City, the police conducted more than 4 million pedestrian stops between 2004 and 2012.
What Percentage of NYC’s Students with Disabilities are Served in Inclusive Settings? Exploring Equity and Changes Over Time.
Federal law mandates that students with disabilities be served in the “least restrictive” educational environment possible. This post examines the percentage of NYC students with disabilities who have access to inclusive classroom settings.
What are the Contours of NYC’s Special Education Landscape?
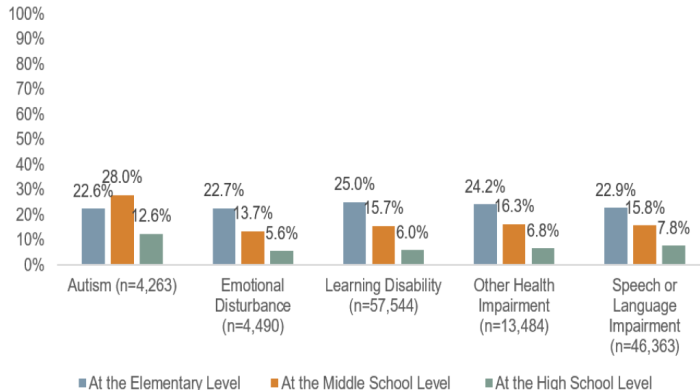
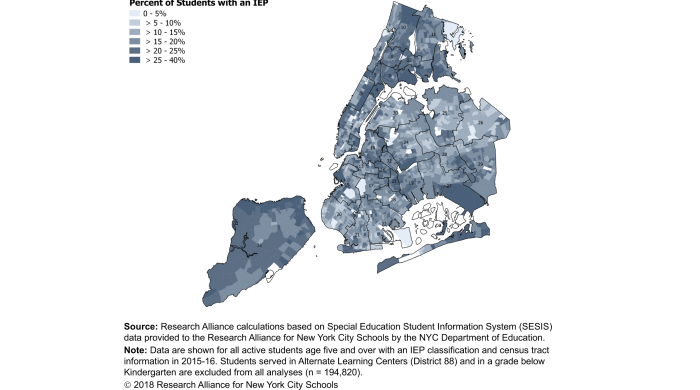
In New York City, more than 200,000 public school students are eligible for special education, as indicated by having an Individualized Education Program (IEP). This post examines IEP rates by census tract, as well as the prevalence of different disability classifications.
How Far Do NYC Students Travel to Get to School?
This Spotlight post uses geographic student and school location data to estimate commuting times for NYC’s elementary, middle, and high school students.
NYC Public Schools: What Does it Mean to be the Nation’s Largest School District?
There are well over a million students enrolled in NYC's public school. As is frequently pointed out, NYC has the largest school district in the country. But what does this mean in relative terms? This Spotlight post features an interactive graph allowing users to compare the population of NYC schools to the next three largest urban districts.
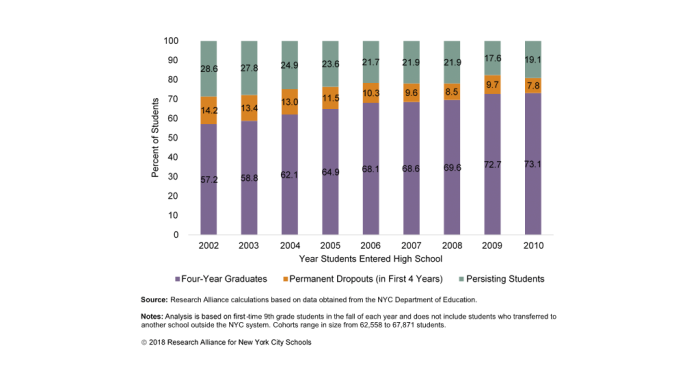
How Have the Rates at Which Students Are Graduating in Four Years, Dropping Out, or “Persisting” in NYC High Schools Changed Over Time?
There is much to celebrate in New York City’s rising high school graduation rate—over the past decade, the percentage of students who earn their diploma in four years has steadily increased, and rates of college enrollment have largely kept pace.
Understanding School Survey Response Rates
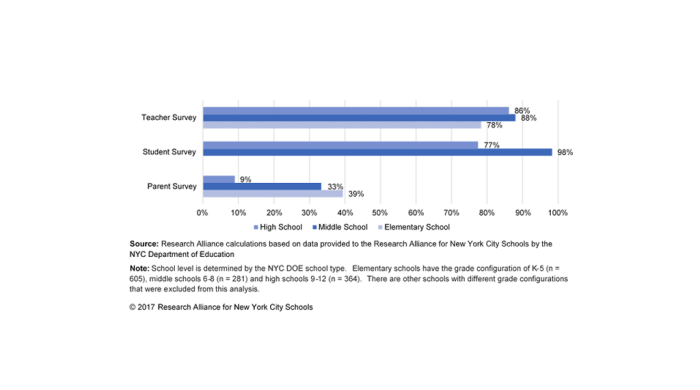
Each year since 2006, the NYC Department of Education (NYC DOE) has distributed an annual School Survey to all students in grades 6-12, as well as all teachers and parents in the district. This survey—the largest education census in the United States—provides important information about the school climate in the district’s 1,800 schools.
Where Do Puerto Rican Students Live in New York City?
Hurricanes Irma and Maria devastated Puerto Rican homes, infrastructure, and lives. New York City is home to the largest Puerto Rican population of any city in the world, and many students of Puerto Rican descent attend our schools.
Have Students Become More or Less Likely to Change Schools?
The movement of students from school to school—which researchers refer to as “mobility”—is pervasive across urban school districts in the United States. For mobile students, changing schools and neighborhoods can disrupt the learning process. For schools, high student turnover can undermine efforts to build a cohesive and supportive community.
Who Are the “Diversity in Admissions” Pilot Schools?
In June 2017, the NYC DOE released a diversity plan, which included the expansion of the "Diversity in Admissions" pilot program that was taking place in 21 schools. This post takes a closer look at these schools and the methods they have chosen to try to improve or preserve diversity among their students.
How Many Male Teachers of Color Work in NYC?
The “NYC Men Teach” initiative was launched in 2015, aiming to “put an additional 1,000 men of color on course to become NYC public school teachers over the next three years.” This comes in response to a growing body of evidence suggesting that it is important for students of color to have access to educators of color.
What is the Gender Breakdown of NYC Teachers?
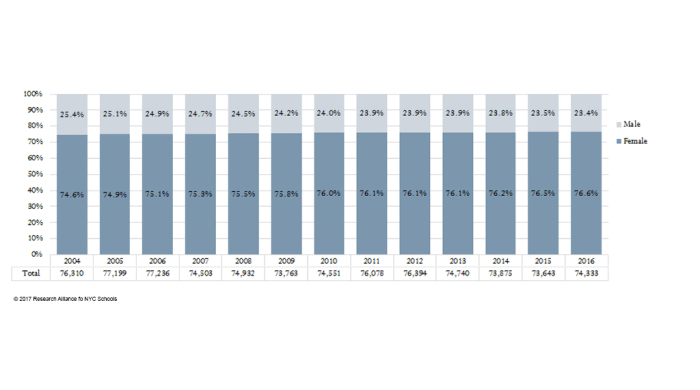
From 2003-2004 to 2015-2016, the size of NYC’s teacher workforce remained relatively stable, hovering around 75,000. During this time, the proportions of men and women shifted, but only slightly. Women made up 74.6% of the City’s teacher workforce in 2003-2004, growing to 76.6% in 2015-2016.
Suspensions are Down. What Does this Mean for School Safety?
This post explores students' perceptions of safety in schools with higher and lower suspension rates.
Exploring Pathways to a College Degree
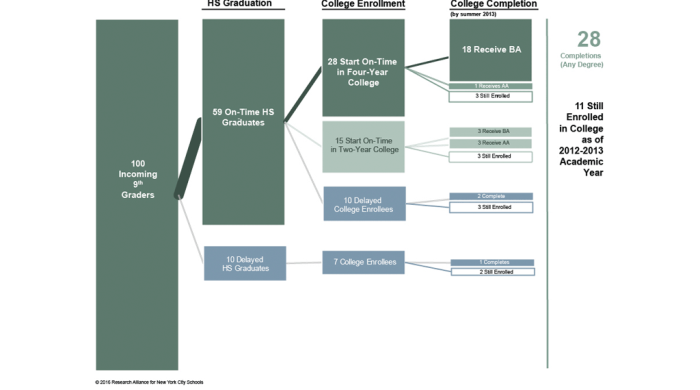
This post displays the educational trajectories of students who entered 9th grade in a NYC public school in 2003. The data allow us to follow these students for a full 10 years after their entry into high school.
When Do Students Enter and Exit the NYC Public School System?
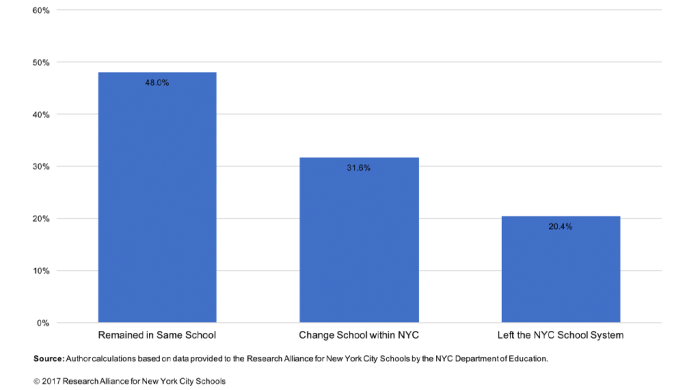
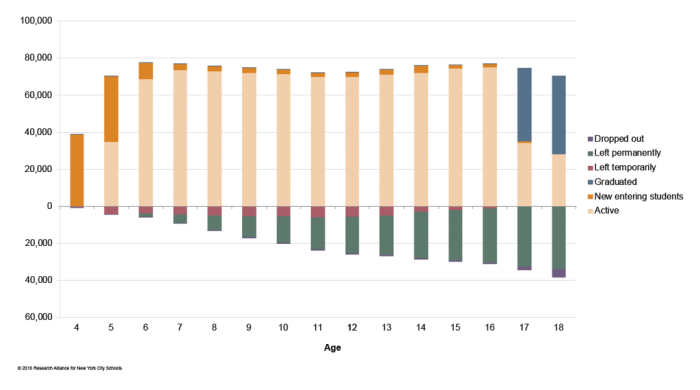
This post examines patterns of entry and exit from the NYC public school system for students who were born in 1996 (i.e., students scheduled to enter kindergarten in September 2001, and to graduate high school in June 2014).
Trends in School Co-Locations in NYC
The practice of school co-location—when multiple schools are housed within a single building—has generated considerable controversy in New York City. Under the previous administration, policies that emphasized closing persistently low-performing schools (and in many cases, replacing them with a number of smaller schools in a single building) as well as the growth of charter schools
How Does Concentrated Poverty Intersect with High School Choices?
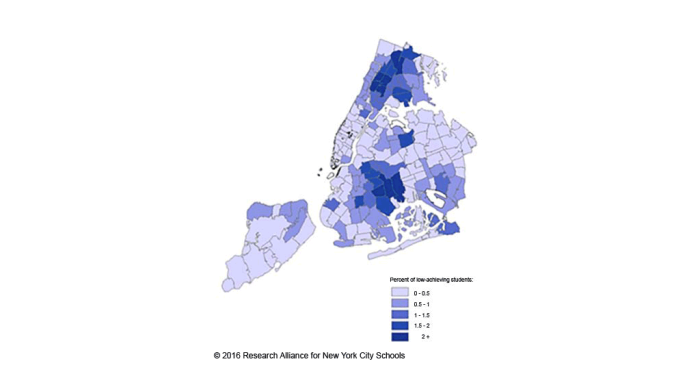
This post shows the concentration of low-achieving 8th graders in specific, high-poverty areas of the City, and considers the implications for high school choice.

