How Often Are NYC Students "Going It Alone"?
New York City’s high school landscape has undergone dramatic shifts during the last two decades. During this time, the district closed many large, persistently low-performing schools; opened hundreds of new small schools; and expanded high school choice to students throughout the district. The resulting terrain offers students a multitude of high school options. However there are notable differences in the number and size of schools available across the five boroughs. Small themed schools predominate in Manhattan and the Bronx, for example, while Queens and Brooklyn offer a mix of school sizes; Staten Island retains mostly large comprehensive high schools.
Students can apply to any high school in the City, but prior studies have found that families generally prefer schools that are closer to home. Some high schools give admissions priority to students who live nearby or attend a feeder middle school. Because of these factors, we might expect to see a fairly high degree of “peer continuity” as students move from middle to high school. While there is some evidence that having a stable group of peers matters for students’ emotional well-being, academic outcomes, and ties between families, the research to date is relatively thin. In fact, prior to this analysis, we are not aware of any research examining the extent of peer continuity from middle to high school in New York City, let alone its effects.
How much peer continuity is there for NYC students as they make the critical transition into 9th grade?
Leveraging data from the Research Alliance archive, we have been able to measure peer continuity in several ways. For example, we found that the average NYC student enrolls in high school with about 12 percent of their 8th grade class. We also looked at cases in which students were the only person from their 8th grade class to attend their high school. [1] Figures 1A and 1B below focus on these students—and how the likelihood of “going it alone” varied by race/ethnicity and neighborhood poverty.
Figure 1A: Students With No Middle School Classmates in their 9th Grade Class, by Race/Ethnicity
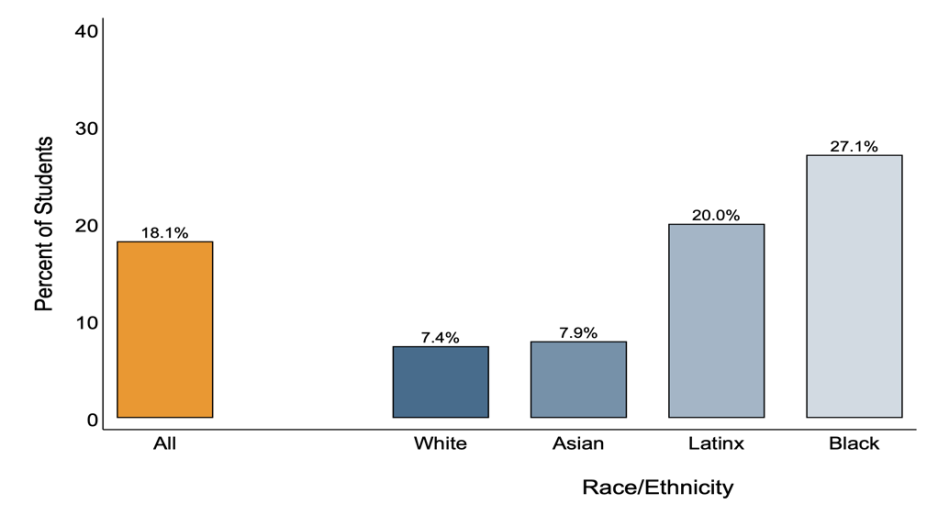
Figure 1B: Students With No Middle School Classmates in their 9th Grade Class, by Neighborhood Poverty
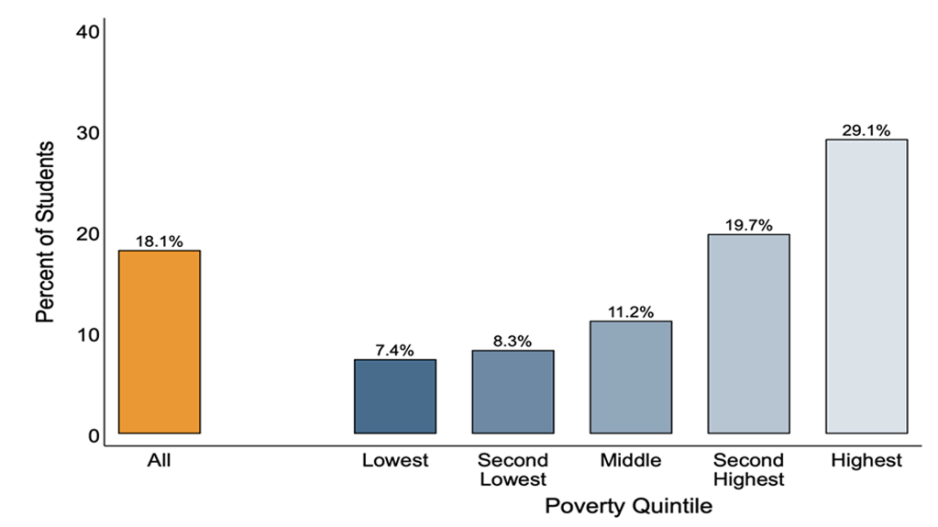
Overall, nearly 1 in 5 students ended up as the only person from their middle school to enroll in their 9th grade class. As shown in Figure 1A, this average obscures sharp differences in peer continuity by race/ethnicity. Fully 27 percent of Black students were the only one from their 8th grade class at their high school, compared with 20 percent of Latinx students and less than 8 percent of White and Asian students. Likewise, there were large differences associated with neighborhood income, as seen in Figure 1B. Those living in the most advantaged neighborhoods experienced the most peer continuity. Conversely, 29 percent of students in neighborhoods with the highest levels of poverty had no classmates from middle school in their 9th grade class.
How similar are students’ choices?
One question raised by these findings is whether differences in peer continuity reflect comparable differences in students’ choices (e.g., are students in high-poverty neighborhoods less likely to coordinate with classmates about the schools to which they are applying?). In Figures 2A and 2B, we examine application similarity within middle schools. Each bar displays—for the average student—the percentage of their 8th grade classmates who listed that student’s first choice high school among their top three choices. [2]
Figure 2A: Within-School Application Similarity, by Race/Ethnicity
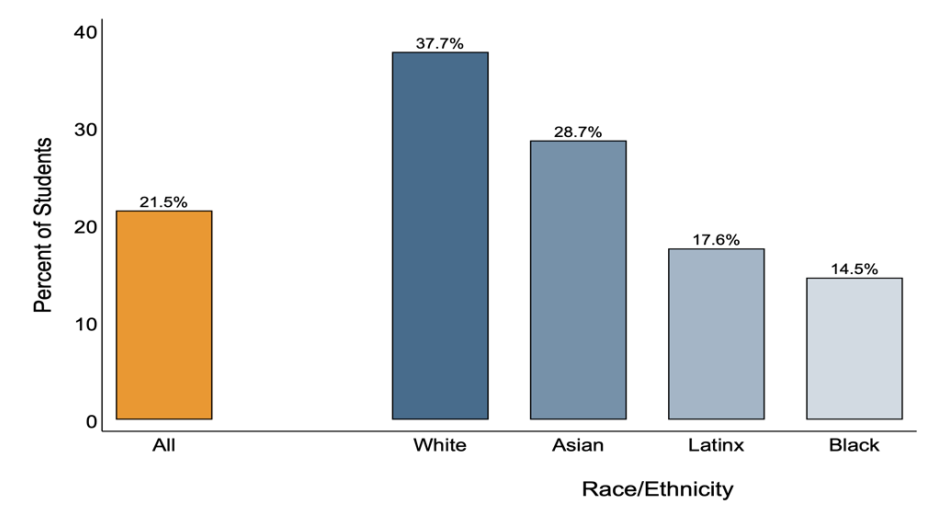
Figure 2B: Within-School Application Similarity, by Neighborhood Poverty
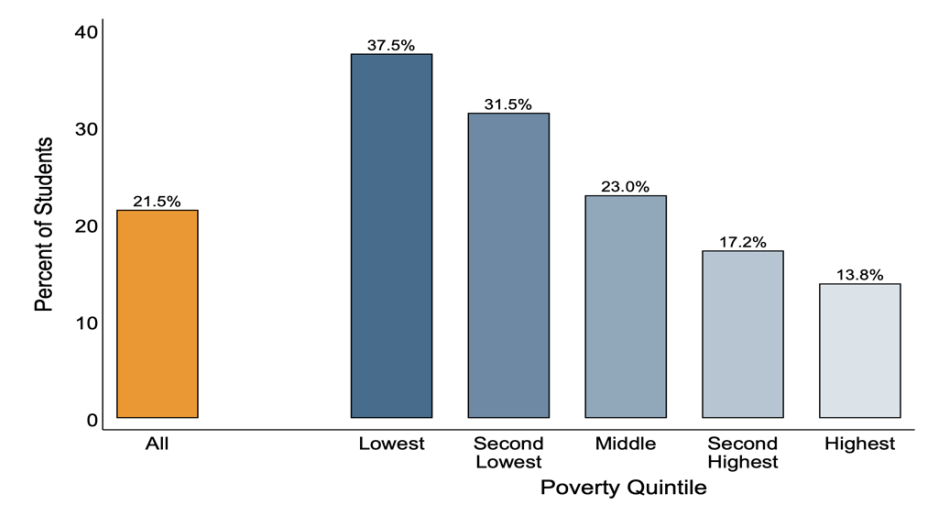
The figures show large differences in application similarity by race/ethnicity and neighborhood poverty, mirroring those observed for peer continuity. These findings suggest that the main reason students do not go to high school with peers from their 8th grade class is that they apply to different schools. Indeed, our study found little evidence of widespread coordination in applications among students in the same middle school. For instance, for 7 of 10 applicants, no other applicant in their middle school shared the exact same three top ranked choices.
Much remains to be learned about the factors influencing students’ choices and peer continuity in 9th grade. But the supply of local schools appears to play a role. Students who live in neighborhoods with more (and smaller) school options are less likely to remain with peers as they transition from middle to high school. Still, a large portion of the differences highlighted above remain unexplained. Black and Latinx students, and those in high-poverty neighborhoods, apply to and attend high school with a much smaller fraction of their middle school peers than do their White, Asian, and low-poverty counterparts. This may be a matter of personal preference, a reflection of system-wide segregation by race and class, a function of the larger supply of school options in certain neighborhoods—or, in all likelihood, a combination of all of these and other factors. Below we highlight some important next-step questions for policy and practice.
Big Questions:
- What explains the lack of similarity in high school applications in some middle schools, especially those serving lower-income New Yorkers? Does this reflect more school options and widely divergent preferences, or weaker counseling and a lack of good information?
- What are the consequences of the lack of peer continuity for NYC students? Are there effects on friendships, social isolation, sense of belonging, or academic outcomes? Are students more or less satisfied with their high school experience, depending on whether they have had access to a stable group of peers from middle school?
Peer continuity is not necessarily a positive thing for all students. While, for some, remaining in school with peers will likely bring benefits, others might be better off with a “fresh start.” Learning more about the effects of peer continuity (or going it alone), and how they vary for different subgroups of students, could provide useful guidance for efforts to support young people, both socially and academically, as they transition into high school.
This post was authored by Nicholas D.E. Mark, Sean P. Corcoran, and Jennifer L. Jennings, with Chelsea Farley. For more detailed findings, please see Choosing Alone? Peer Continuity Disparities in Choice-Based Enrollment Systems.
Endnotes
[1] In New York City, there can be multiple “programs” within a high school and multiple schools within a single building. The analyses presented here focus on schools, not programs or buildings. So, for example, students could still be classified as "going it alone" if others from their 8th grade class enrolled in a different school within the same building. By contrast, if students from the same 8th grade class went to different programs within a high school, they were considered to be attending the same high school–and therefore not included in Figures 1A and 1B.
[2] We looked at application similarity in several ways—including looking only at students' first choice (rather than top three)—with similar results.
Figure Notes
Source: Author calculations based on data provided to the Research Alliance for New York City Schools from New York Department of Education.
Notes: Data are from high school applications from 2014-15 matched to student demographic, residential location, and achievement information. Similarity is operationalized as the proportion of students in a reference group who ranked a students’ first choice school among their top three choices. Isolation is measured via an indicator of whether a student attended high school with at least one member of their reference group. The sample includes students attending combination middle and high schools where they had the option to remain in their school in 9th grade. As expected, these students were more likely to remain together with peers. When we exclude them from the sample, overall peer continuity is even lower.
What else should we be asking about peer continuity? Email us at ResearchAllianceSpotlight@nyu.edu.
Suggested Citation
Mark, N., Corcoran, S., Jennings, J., with Farley, C. 2023. "Peer Continuity from Middle to High School: How Often Are NYC Students Going It Alone?" Spotlight on NYC Schools. Research Alliance for New York City Schools.

