

Each year since 2006, the NYC Department of Education (NYC DOE) has distributed an annual School Survey to all students in grades 6-12, as well as all teachers and parents in the district. This survey—the largest education census in the United States—provides important information about the school climate in the district’s 1,800 schools.
One of challenges of administering a survey to a very large population is ensuring as many responses as possible. In general, the higher the response rate, the more likely it is that a survey’s results will fully represent the perspectives of the larger population. Researchers commonly consider a response rate of 70 percent or more to be sufficient, but as we describe below, there are a number of factors to consider when assessing response rates.
First, the response rate for each major group of respondents matters. In NYC, teachers and students are much more likely to take the survey than parents. For example, in the 2015-2016 school year, teacher response rates hovered around 85 percent for all grade levels; the student response rate stood at 87 percent for middle schoolers and 73 percent for high schoolers.[1] But, for parents, response rates were much lower—64 percent for elementary school parents, 57 percent for middle school parents, and just 35 percent for high school parents.
Second, it is often necessary to consider response rates not only at the district level, but also for each individual school. In NYC, this is important because the Survey is used both to examine conditions across the overall system and to learn about each school’s particular strengths and weaknesses.
The figure below shows the percentage of schools that had a 70-percent response rate or better in the 2015-2016 school year, for each respondent group and grade level.
Percentage of Schools with High Response Rates (≥70 Percent) by Type of Respondent and Grade Level, 2015-2016
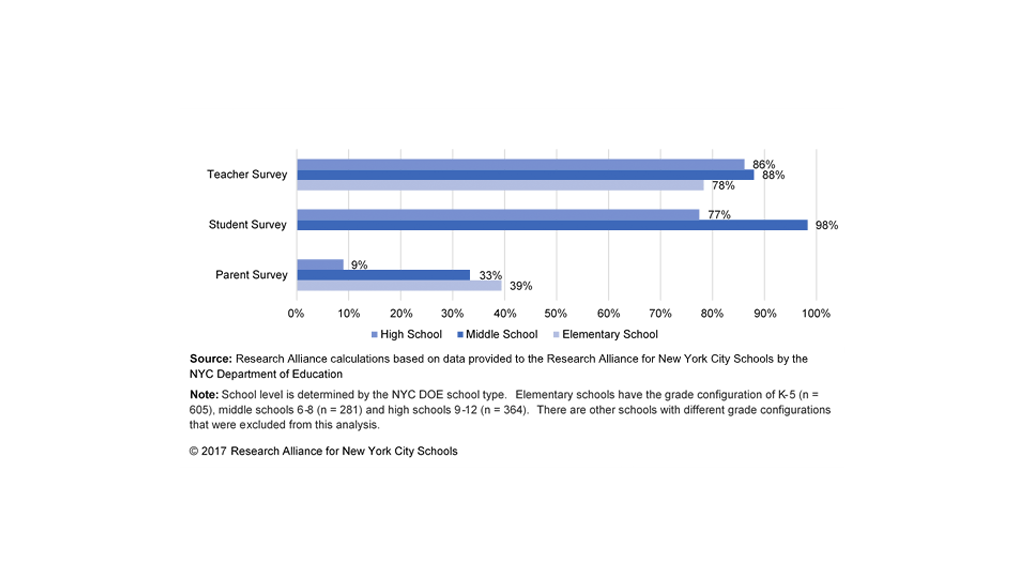
We see that, for the teacher survey, a large majority of schools across all grade levels achieved the 70 percent response rate. For the student survey, almost all middle schools met this threshold, but about a quarter of high schools did not. For the parent survey, most schools struggled to achieve a 70 percent response rate—91 percent of high schools, 67 percent of middle schools and 61 percent of elementary schools did not meet the threshold for parents. This suggests that, for most schools, teacher and student responses provide more accurate information about the school’s strengths and weaknesses than do parent responses.
Of course, the 70 percent threshold is somewhat arbitrary. Can we trust the results for a school with a 71 percent response rate, but not for a school with a 69 percent response rate? It’s impossible to say without more information. The 70 percent threshold provides us with a handy cut-off point, but is far from infallible.
Particularly when response rates are low, it is important to ask whether survey respondents are different, in meaningful ways, from non-respondents. If, for instance, a school has a 25 percent response rate among parents, we would worry that the results don’t accurately represent all parents’ thoughts about the school. Maybe that 25 percent was more motivated to complete the survey because they are particularly unsatisfied with the school. Or, conversely, they might be more satisfied than other parents, and they responded to the survey because they want to support the school. Lower response rates don’t necessarily mean that results are skewed, or tell us in which direction they might be biased, but they indicate that we should think hard about whose voices are—and are not—being heard.
Big Questions
- The NYC DOE has invested significant financial and human resources into survey administration, including training a staff member at every school about the logistics and ethics of survey administration, and translating the parent and student versions of the Survey into several languages. How have these investments affected response rates?
- Are there further strategies that could be piloted, in an effort to encourage and incentivize responses – especially for parents, who have the lowest response rates?
- Are there important differences between schools with higher and lower response rates? Do high or low response rates correlate with other indicators of school quality or community engagement?
What else should we be asking about school survey response rates? Are you exploring any of these topics? Let us know via email.
This post was developed using data provided to the Research Alliance for New York City Schools by the NYC Department of Education. Analyses conducted by Lisa Merrill.
Footnotes
[1] Elementary school students do not take the survey.
How to Cite this Spotlight
Merrill, L. 2017. "Understanding School Survey Response Rates" Spotlight on NYC Schools. Research Alliance for New York City Schools.