

In New York City, more than 200,000 public school students are eligible for special education, as indicated by having an Individualized Education Program (IEP).[1] IEPs are written documents that outline educational goals, required special education services, and other information for any public school student with a disability.
The number of NYC students with disabilities is larger than the entire population of most school districts around the country. The number is big in part because the district itself is big (NYC has more students than Los Angeles and Chicago combined). But students in New York City are also more likely to be classified as eligible for special education. About 19 percent of NYC students have an IEP, compared with 14 percent in Chicago, 12 percent in Los Angeles, and just 7 percent in Houston. (This report discusses some of the reasons why special education classification is different from state to state.)
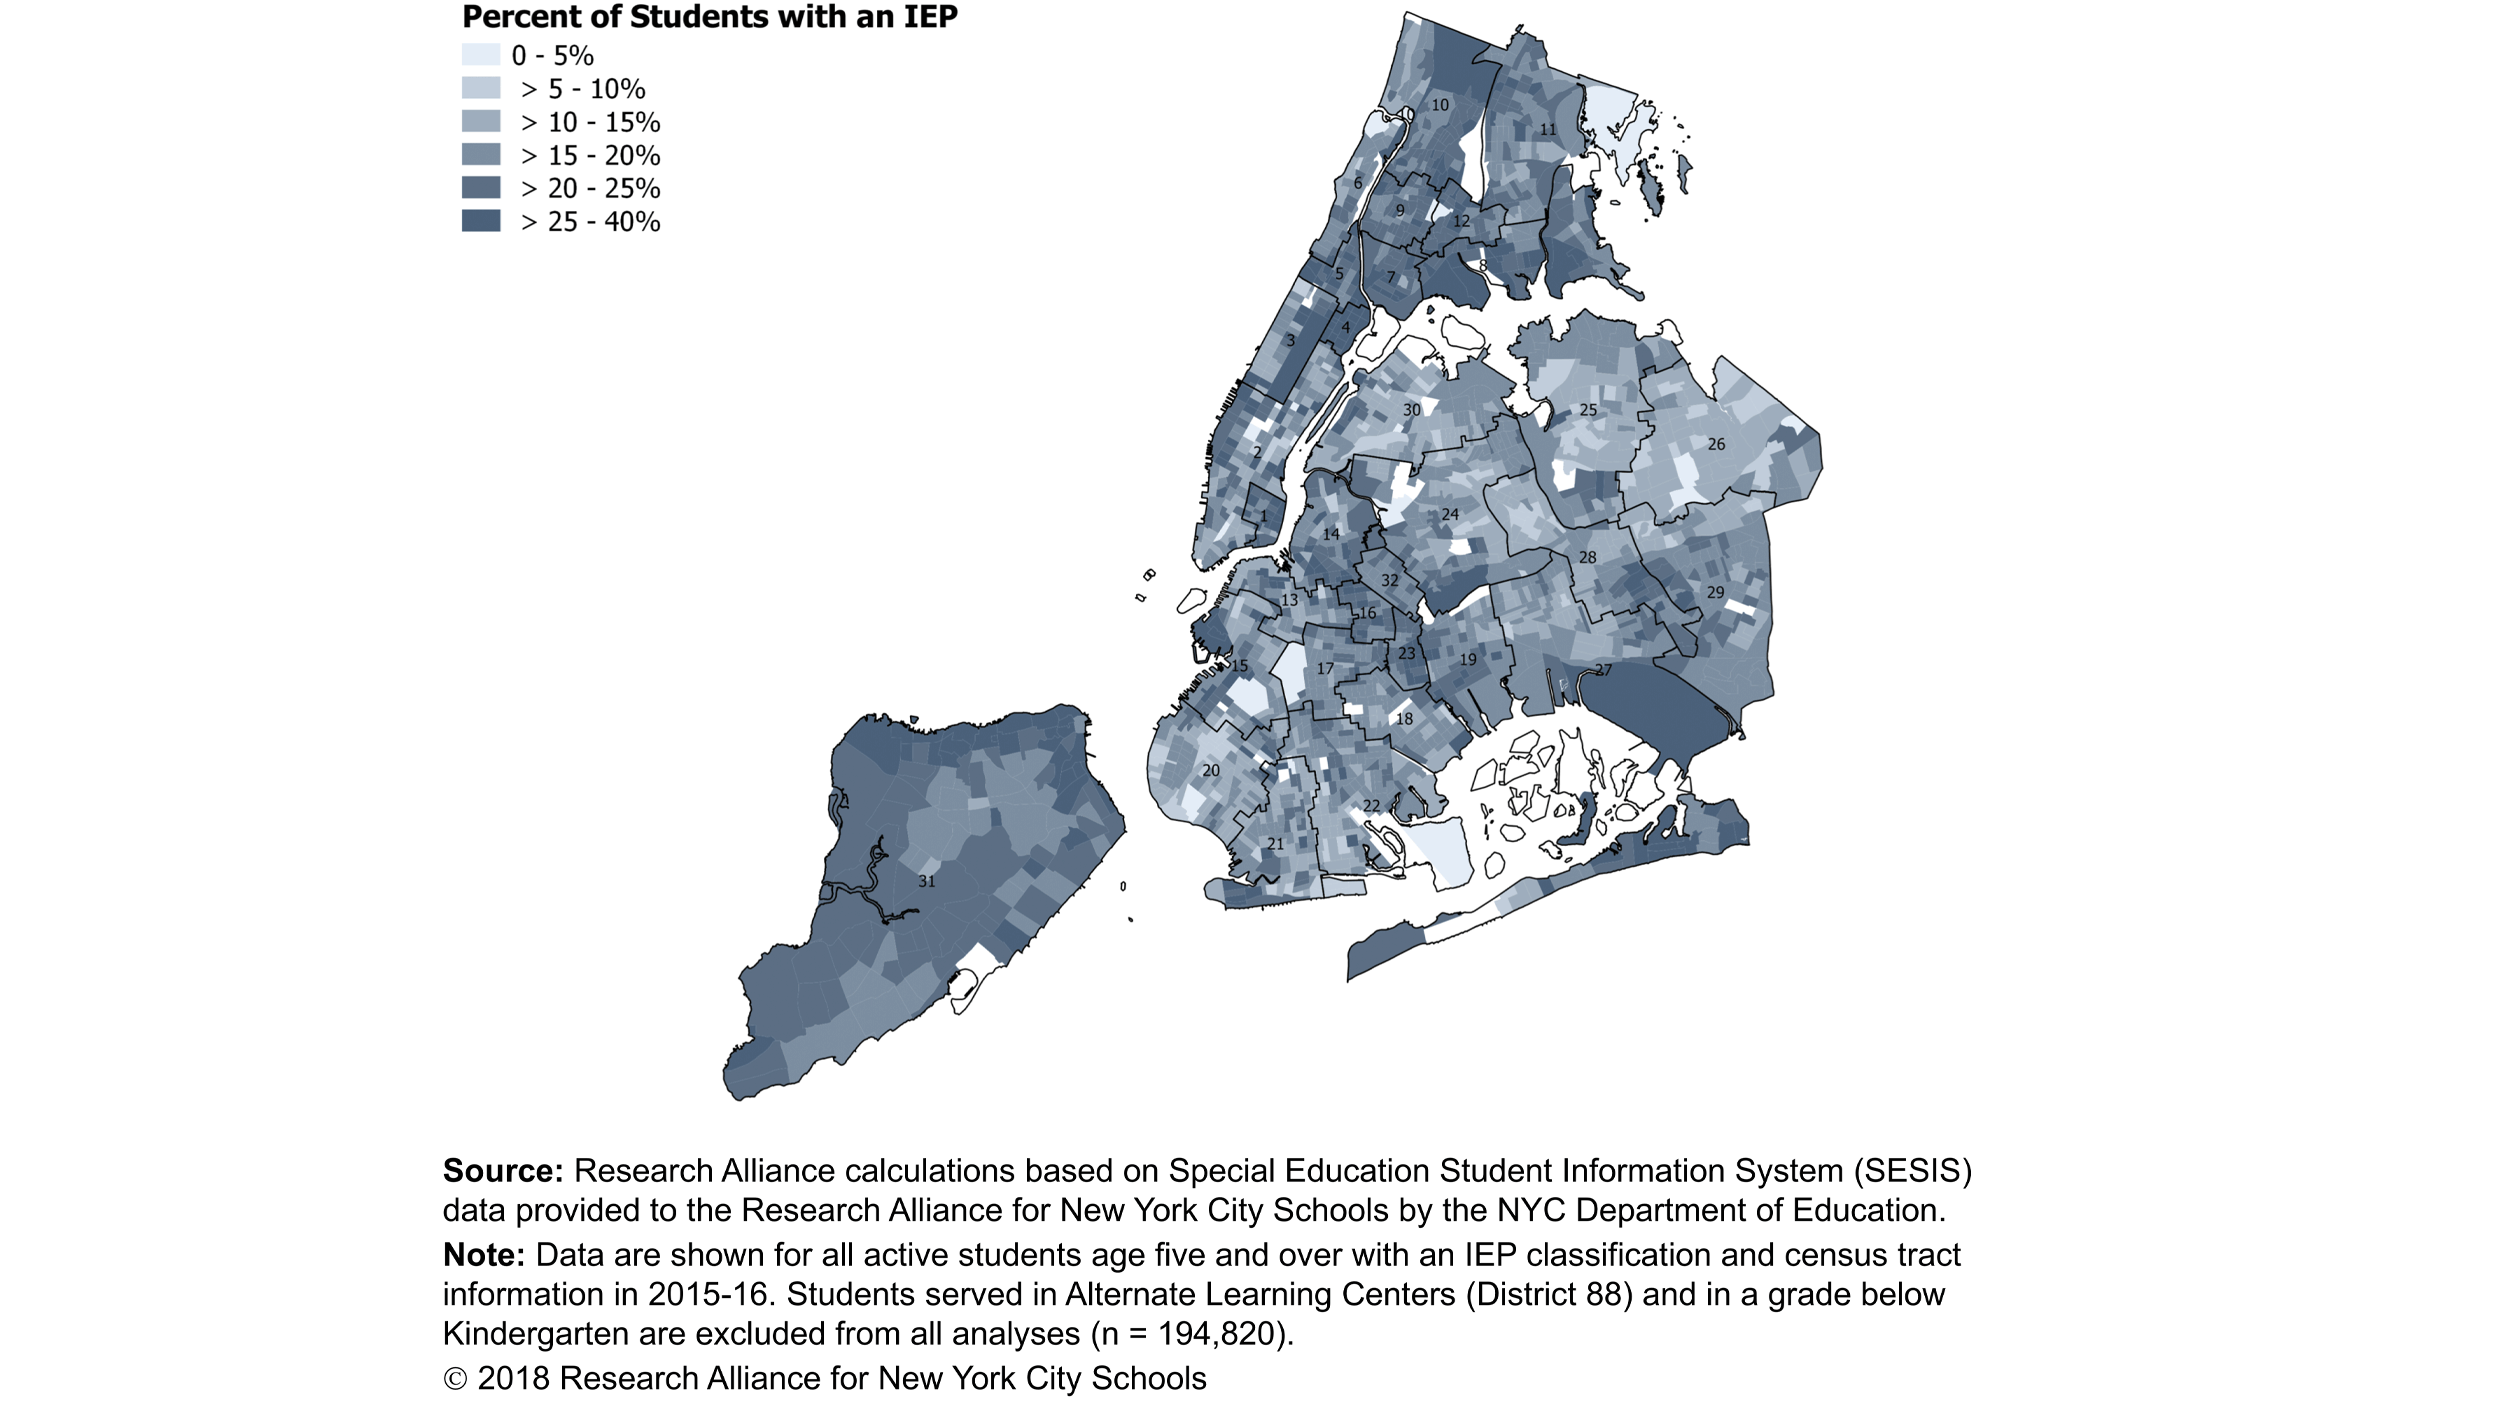
Within NYC, the likelihood that a student will have an IEP varies greatly by census tract. As shown in Figure 1 below, the percentage of students with disabilities ranges from less than 5 percent in some parts of the City (e.g., District 26 in Queens) to over 25 percent in others (e.g., District 4 in East Harlem).
Figure 1: The percent of students with IEPs varies greatly across New York City.
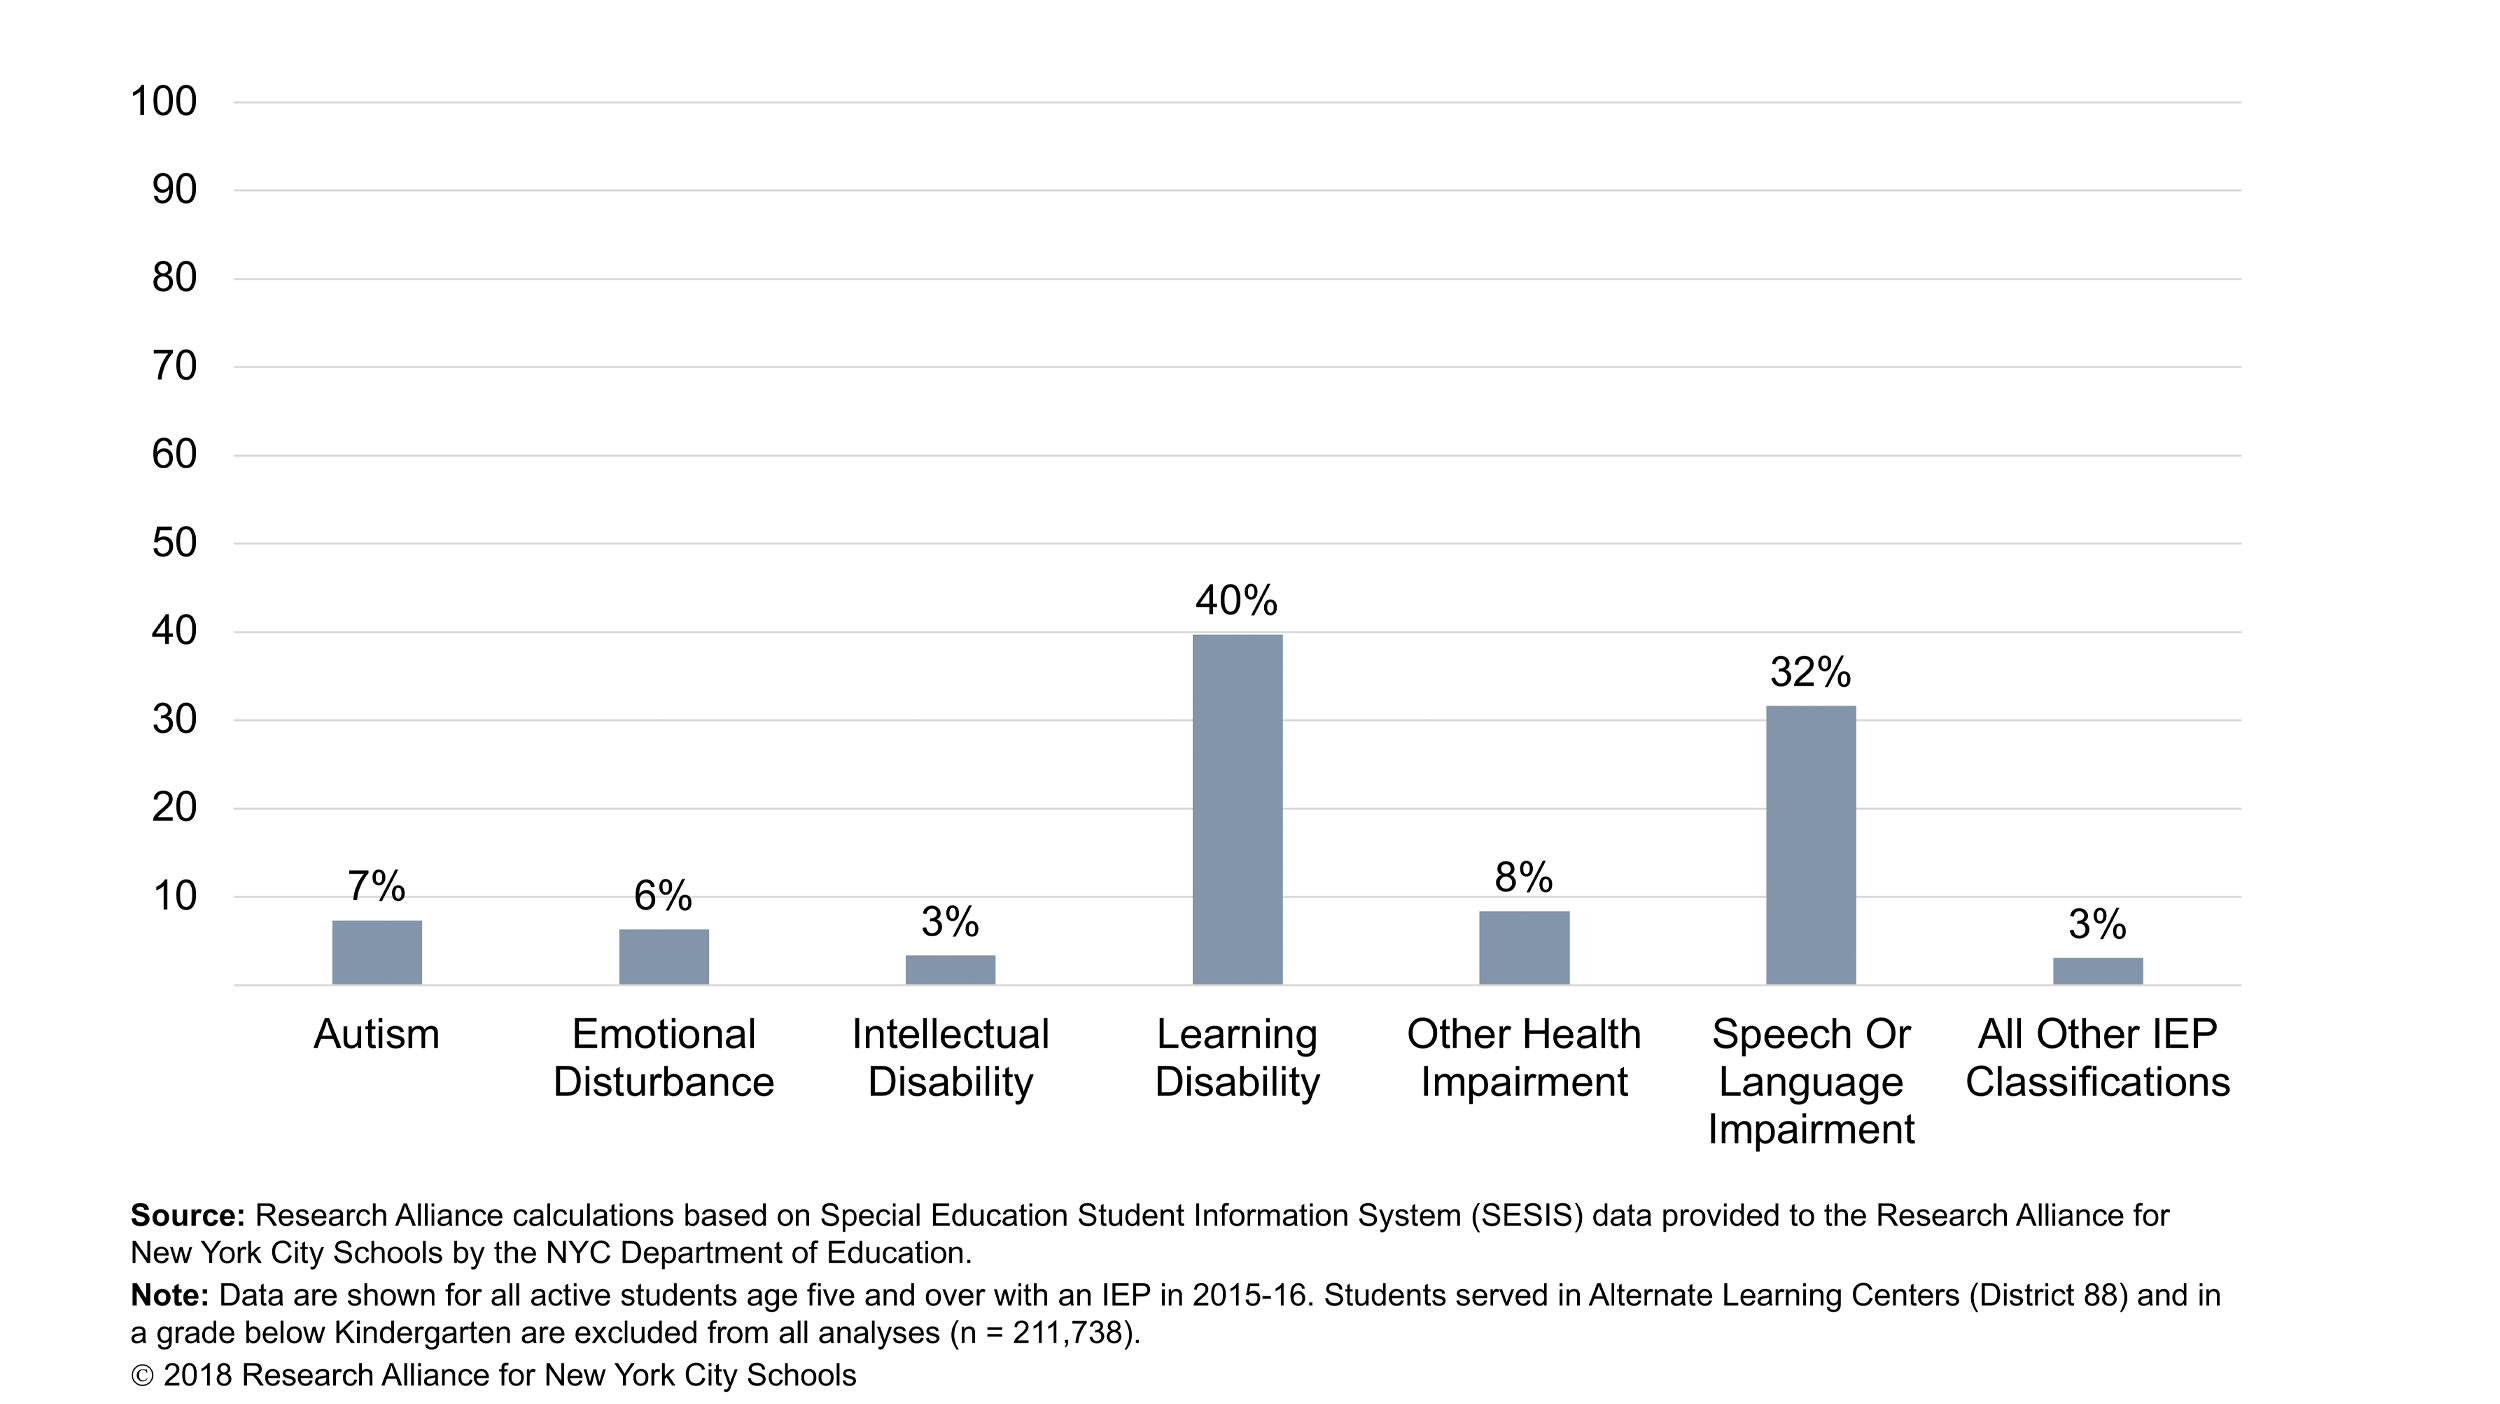
IEPs encompass a wide variety of specific disabilities. Mirroring national figures, the most prevalent disability classifications in NYC are learning disabilities (40% of all students with disabilities) and speech or language impairments (32%). Other relatively common disability classifications include autism (7%); emotional disturbance (6%); and other health impairments (8%). (See the list below for more information about these disability types.)
What Do These Disability Classifications Mean?
- Learning disabilities include dyslexia, congenital brain injuries, disorders that affect how people process and interpret what they see and hear, as well as a variety of other learning problems.
- Speech or language impairments refer to communication disorders (such as stuttering, problems with articulation, and voice impairments) that interfere with a student's performance in school.
- Emotional disturbance includes students with depression, anxiety, obsessive compulsive and conduct disorders.
- Other health impairments includes students with "limited strength, vitality or alertness" resulting from chronic or acute health problems, such as a heart condition, asthma, epilepsy, lead poisoning, attention deficit disorder, etc.
Figure 2: Among students with disabilities, the most prevalent disability classifications are learning disabilities and speech or language impairments.
In NYC, as in other districts, the likelihood of having an IEP—and the specific types of disabilities that students tend to be diagnosed with—vary based on students’ race/ethnicity, gender and socio-economic status. For example, boys outnumber girls with IEPs by two to one. As shown in Figure 3, boys are particularly overrepresented among students classified with autism, emotional disturbance and other health impairments.
Figure 3: Boys are more likely to be classified with autism, emotional disturbance, and other heath impairments.
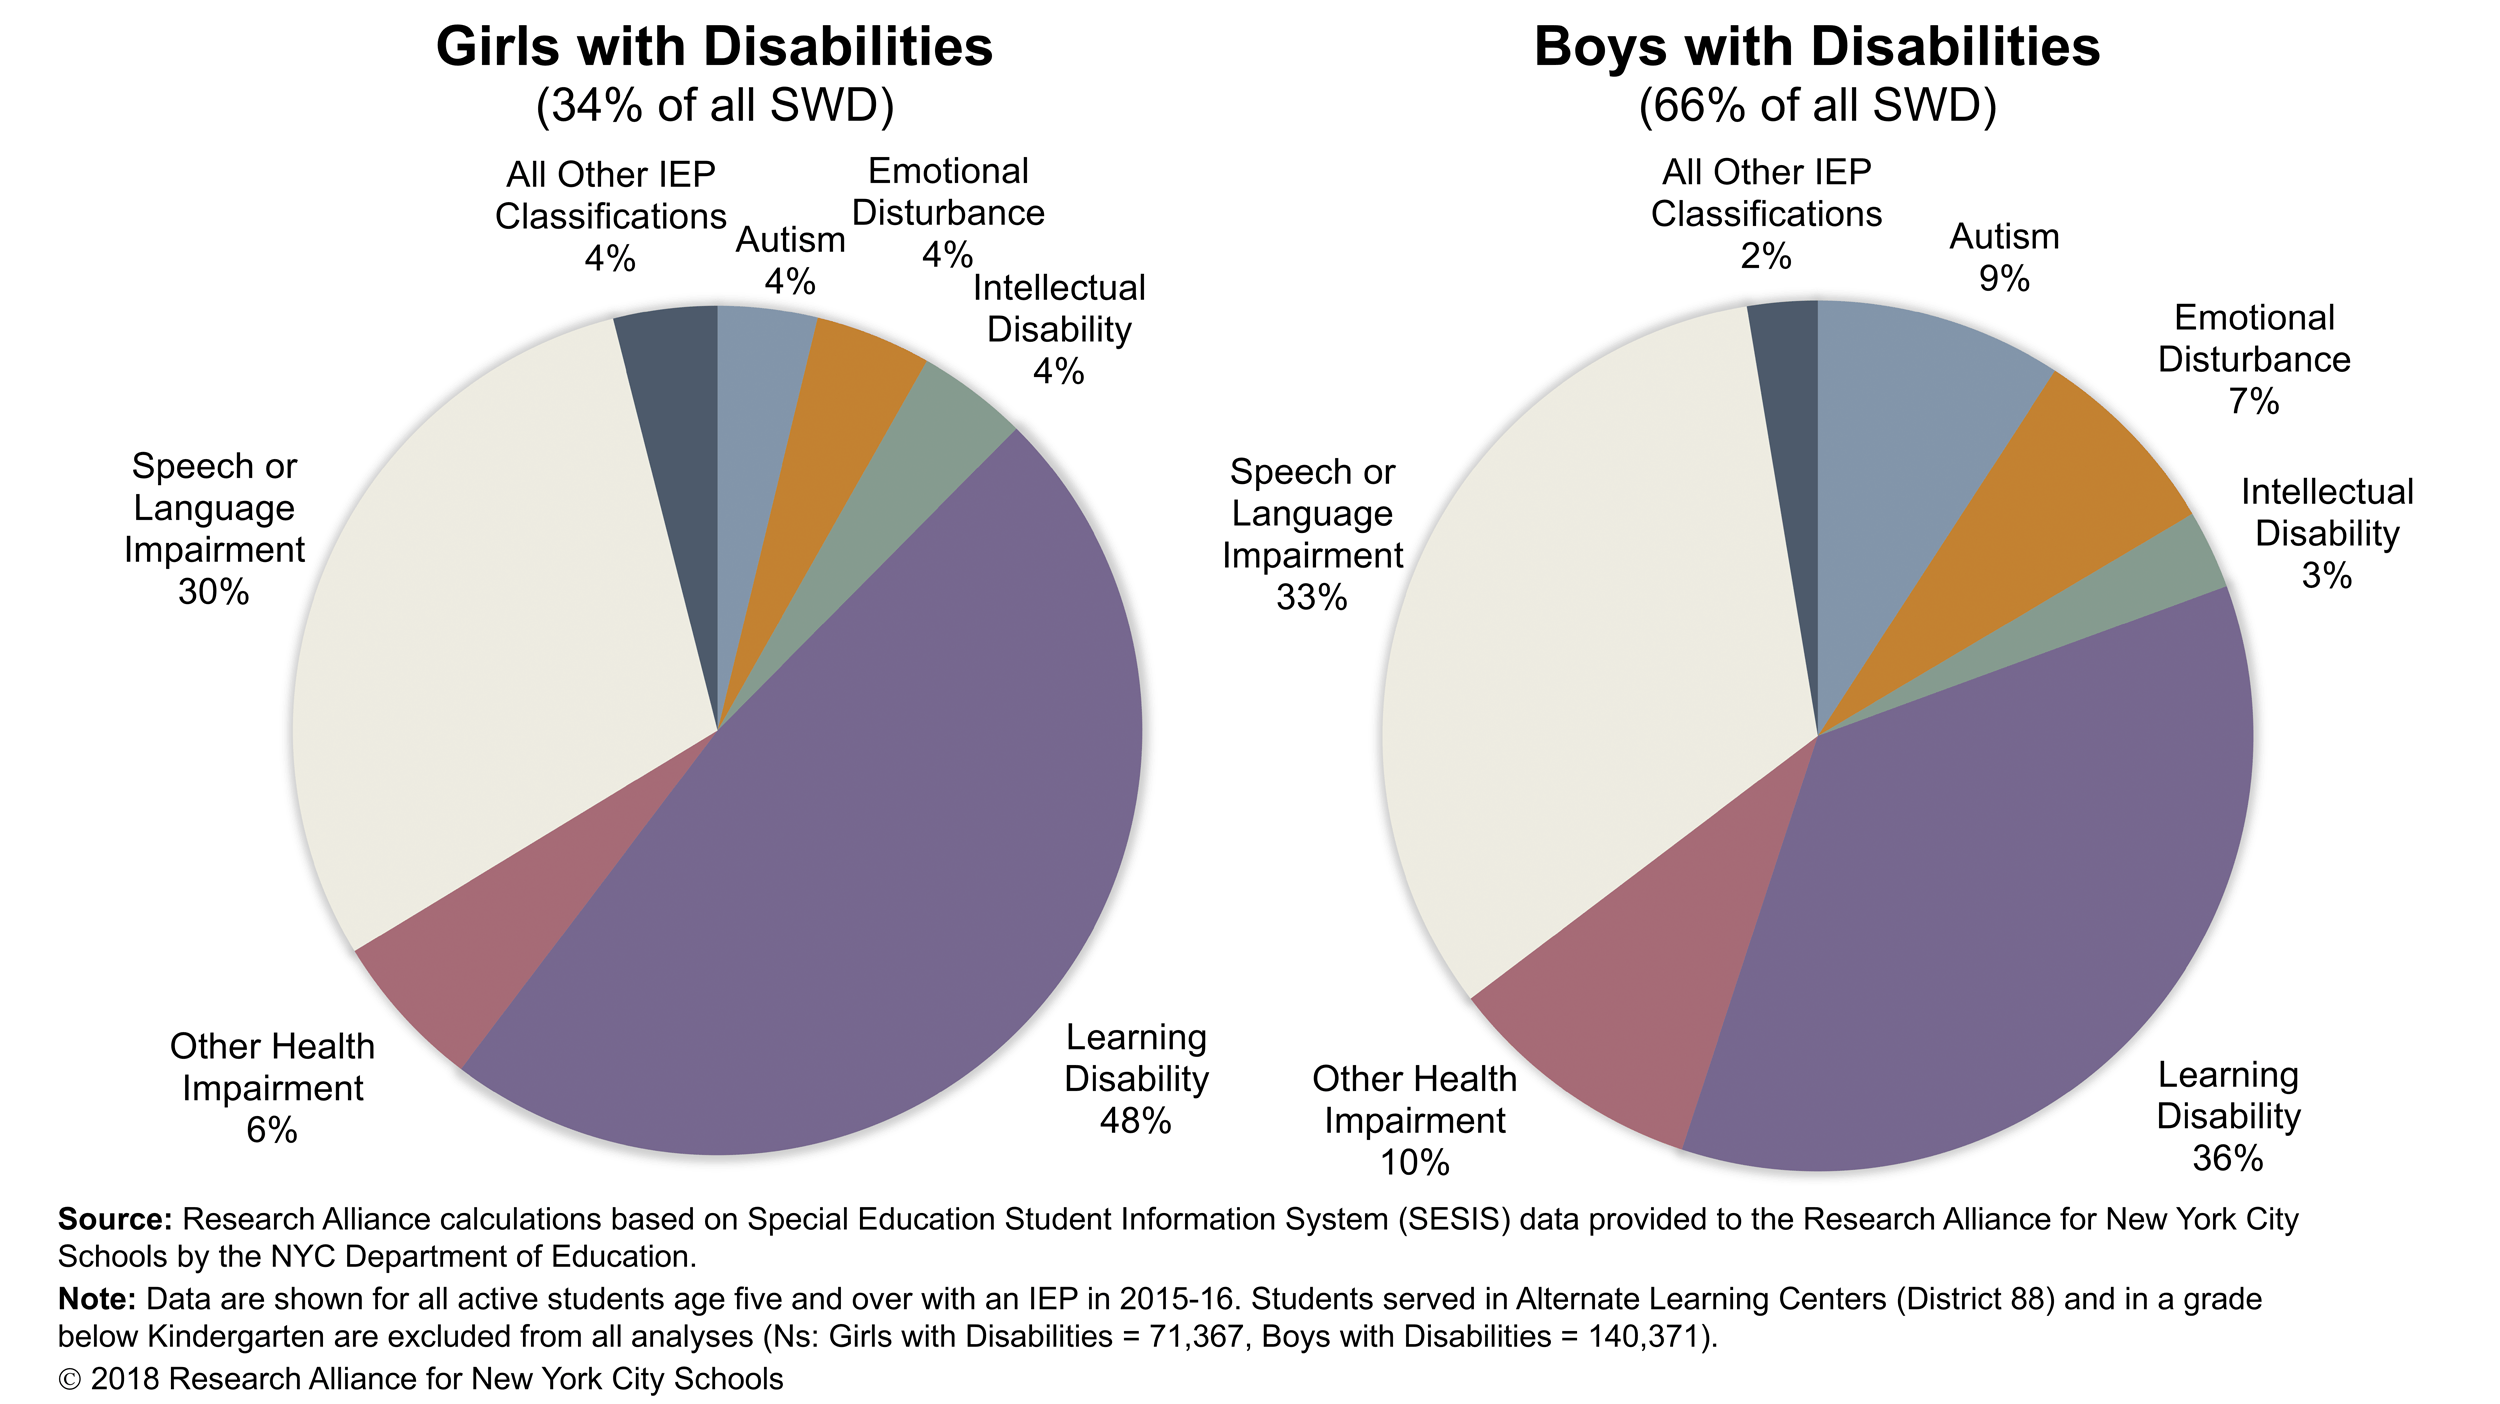
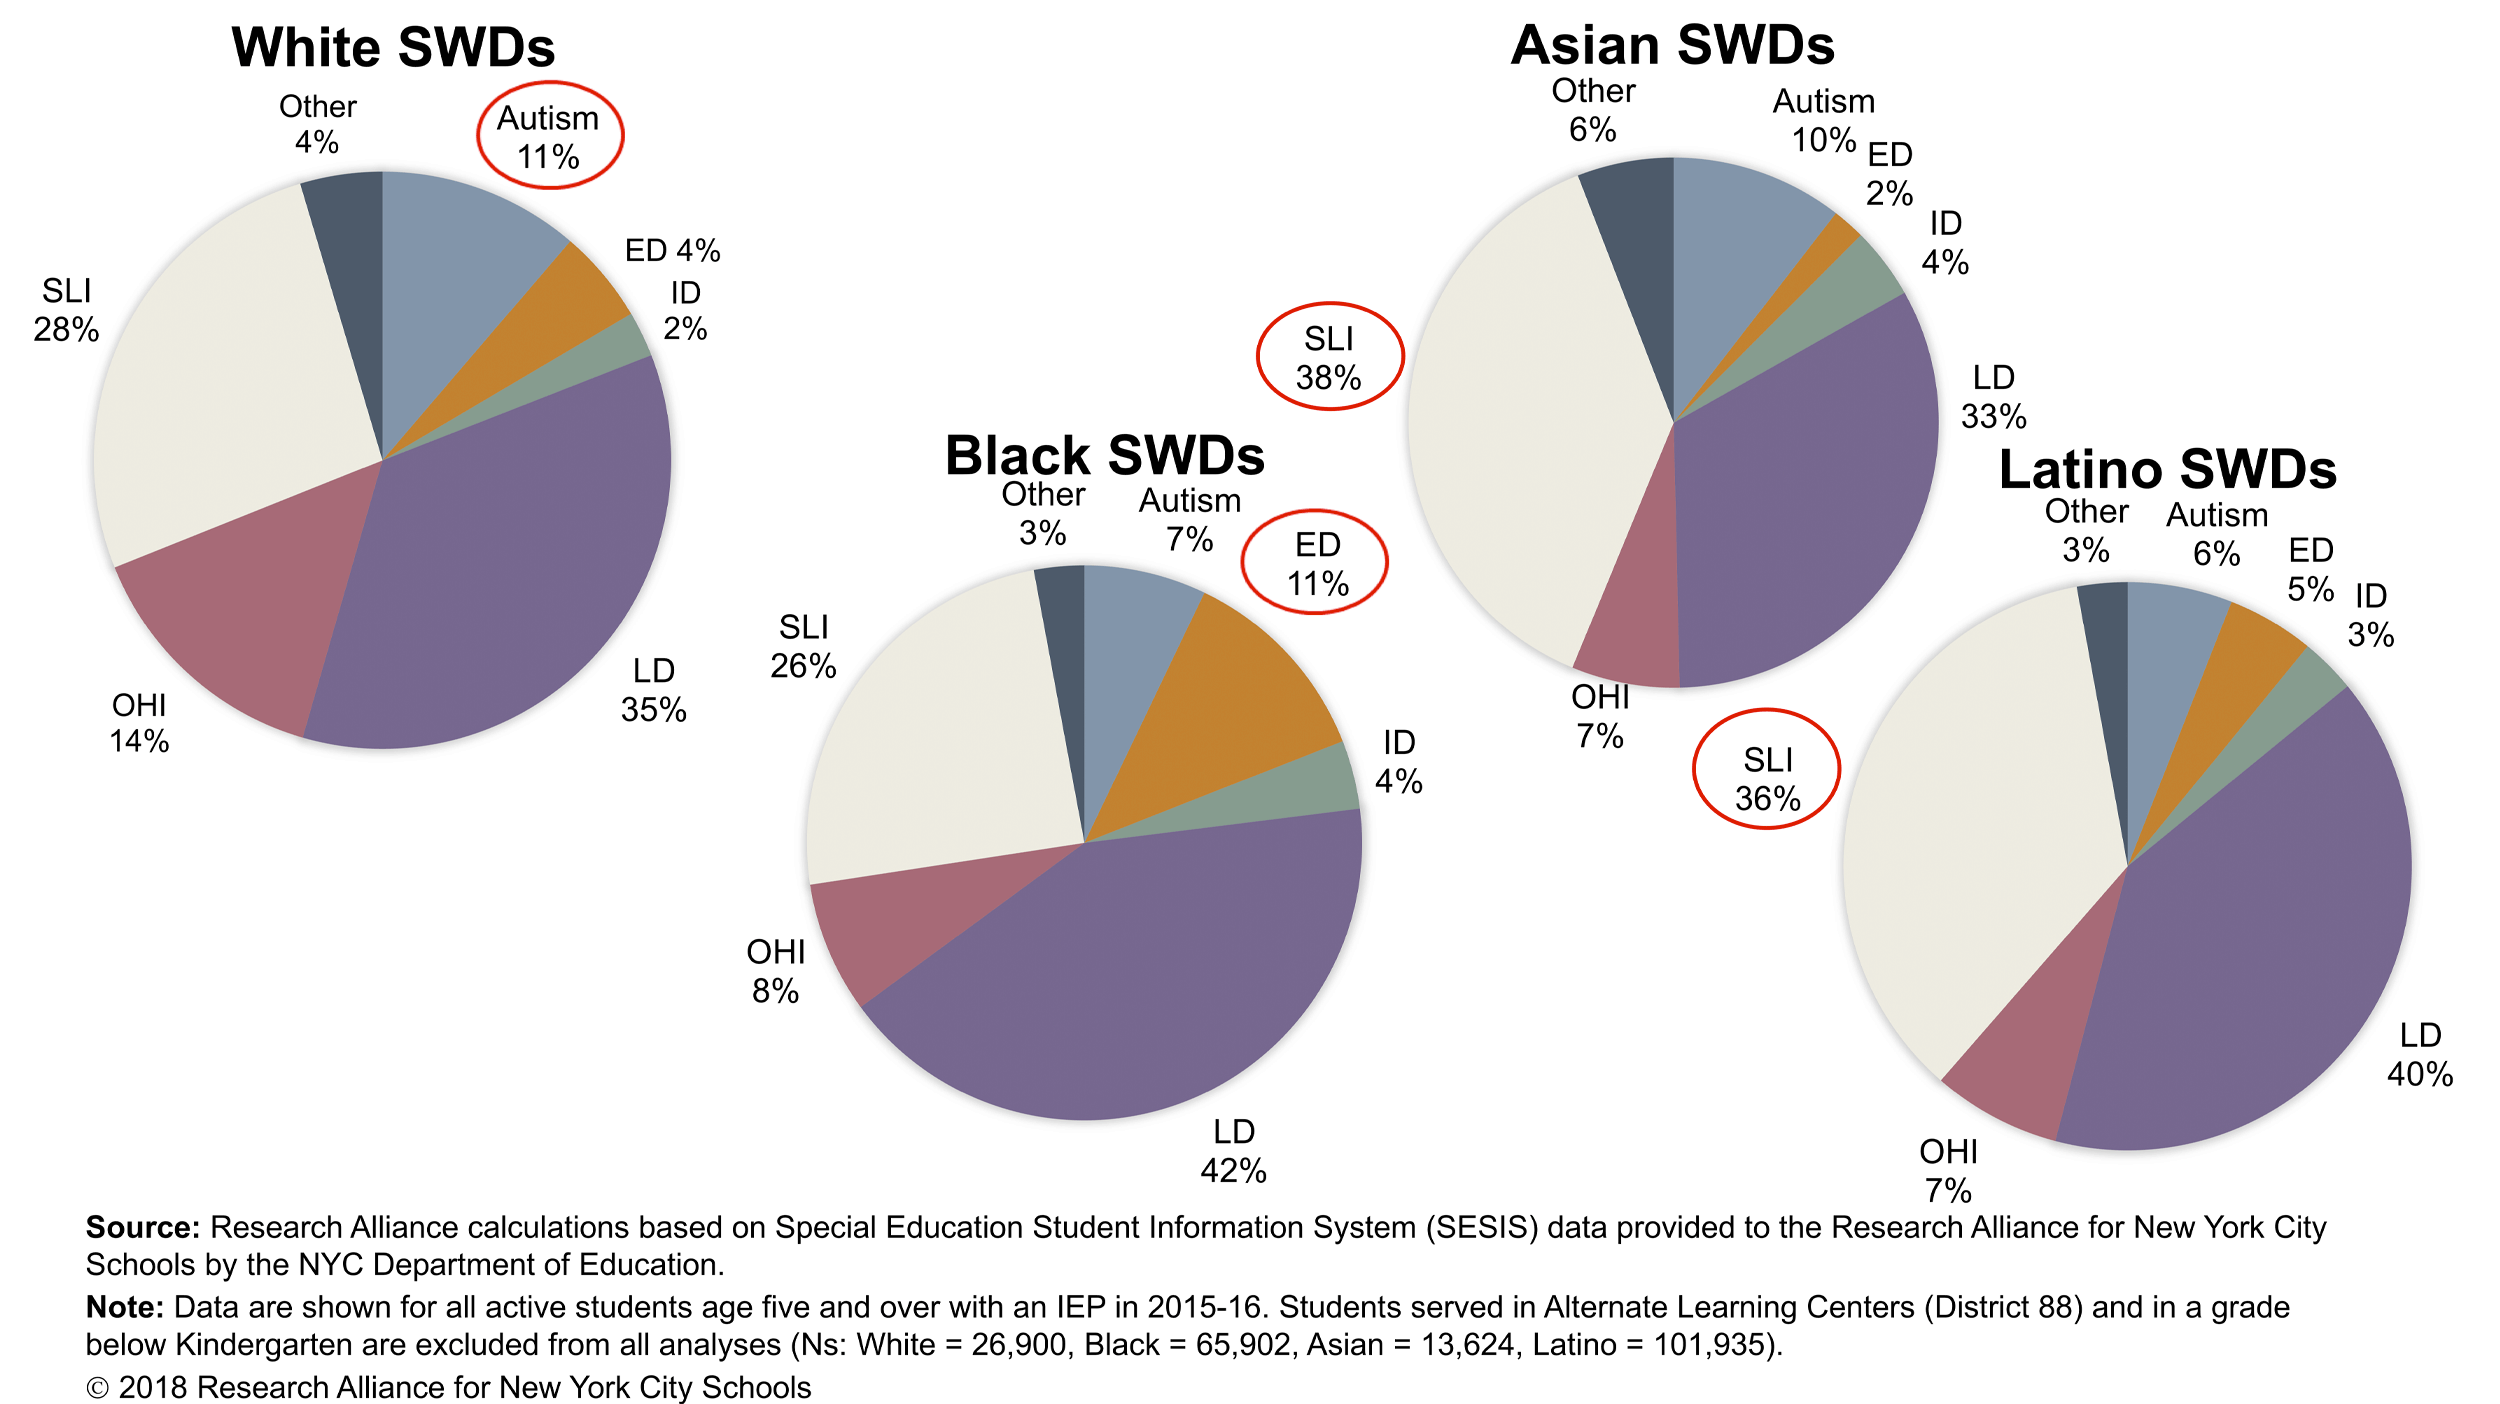
Figure 4 shows that Asian and Latino students are more likely to be diagnosed with speech or language impairments. (Among students with disabilities, 38% of Asian and 36% of Latino students have an IEP for speech or language impairments, compared with 26% of Black and 28% of White students.) This difference is driven in part by the fact that students who are English Language Learners are overrepresented among those classified as having speech or language impairments.
White and Asian students are diagnosed with autism at higher rates than Black and Latino students (11% and 10% of White and Asian students with disabilities, respectively, vs. 7% and 6% among Black and Latino students with disabilities). Finally, Black students are more than twice as likely to have an IEP for emotional disturbance.
Figure 4: Disability classifications vary substantially by race/ethnicity.
In addition, our analyses found that students who live in low-income neighborhoods have slightly lower rates of autism, but slightly higher rates of learning disabilities, emotional disturbance and speech or language impairments, compared with students who live in wealthier parts of the city.
Big Questions
Our findings about the size and composition of the population of NYC students with disabilities raise a number of important questions—some of which the Research Alliance will tackle in forthcoming work.
- How many special education teachers and paraprofessionals are employed in NYC public schools? Are their numbers and training adequate to meet the challenge of educating 200,000-plus students with disabilities in a variety of educational settings?
- What mechanisms are driving disparities in disability rates associated with gender, neighborhood and race? The fact that Black students are more than twice as likely to have an IEP for emotional disturbance was particularly striking. What are the reasons for these high rates (e.g., bias on the part of the evaluators or the criteria used to make the assessment, or higher rates of poverty and exposure to factors known to influence the need for special education, such as emotional stress, poor nutrition, and environmental toxins)?
- What kinds of services are students with disabilities receiving? Do these services differ based on neighborhood, gender, race, and English learner status?
- How many students with disabilities are being served in inclusive educational settings, where they learn alongside peers who do not have disabilities? (For an answer to this question, see our subsequent Spotlight post.)
What else should we be asking about student with disabilities in NYC public schools? Are you exploring any of these topics? Let us know via email.
This post was authored by Cheri Fancsali and Chelsea Farley of the Research Alliance for NYC Schools. Analytical assistance was provided by Patricia Chou.
Footnotes
[1] Research Alliance calculations based on Special Education Student Information System (SESIS) data provided to the Research Alliance for New York City Schools by the NYC Department of Education. The sample includes all students with an IEP classification who are five years or older and who were not enrolled in a District 88 school or in a grade level below Kindergarten for either June or October of the 2015-2016 school year.
This project has been generously supported by the New York Community Trust.
How to Cite this Spotlight
Fancsali, C., Farley, C. 2018. "What are the Contours of NYC's Special Education Landscape?" Spotlight on NYC Schools. Research Alliance for New York City Schools.