In recent years, upwards of 100,000 students in New York City schools have been identified as homeless during each academic year. This group includes students who are doubled-up with family or friends, living in shelters, or living unsheltered (e.g., in cars, on the street). [1] The homeless student population in NYC schools reflects broader and persistent inequities along racial and socioeconomic lines (e.g., Black and Latinx students are starkly overrepresented). Research confirms that students experiencing homelessness face distinct challenges to their educational success—on average, they have lower attendance rates, change schools more often, and have lower scores on standardized tests compared with their low-income (but stably housed) peers.
In this post, we conduct an exploratory analysis of a program called Bridging the Gap (BTG), which was launched by NYC Public Schools (NYCPS) in 2017, with the goal of better supporting students experiencing homelessness. BTG places social workers in schools, where they offer mental health and wellness support to homeless students; they also build relationships with local shelters, city agencies, and community-based organizations to connect students and their families with other resources. The first year that this program was launched, 32 BTG social workers were placed in schools with high proportions of students in shelters. As of the 2023-2024 school year, the City had allocated funding for 100 BTG social workers (at a cost of $10.6 million annually).
The table below shows the number of BTG schools in our analysis, by the year they first received funding for a BTG social worker.
Table 1. When Did Schools in Our Analysis Start Receiving BTG Funding?
First Year of BTG Funding
Number of Schools
2016-2017
17
2017-2018
8
2018-2019
2
2019-2020
6
Total
33
Of paramount importance to NYCPS is ensuring that students experiencing homelessness regularly attend school. For that reason, we examined the extent to which BTG social workers influenced attendance outcomes for three mutually exclusive groups: stably housed students, students who are doubled-up (the largest proportion of students experiencing homelessness), and students in shelter (the group of students BTG social workers are most likely to serve). Our analysis used a “difference-in-differences” approach to compare attendance rate trends in schools that received a BTG social worker to trends in similar schools that did not receive a BTG social worker. This analysis controls for school-level characteristics that do not change over time, as well as some characteristics of schools before they received a BTG social worker. [2] We analyzed data from 2012-2013 through 2021-2022, including information on 33 schools that received BTG and 747 non-BTG schools. [3]
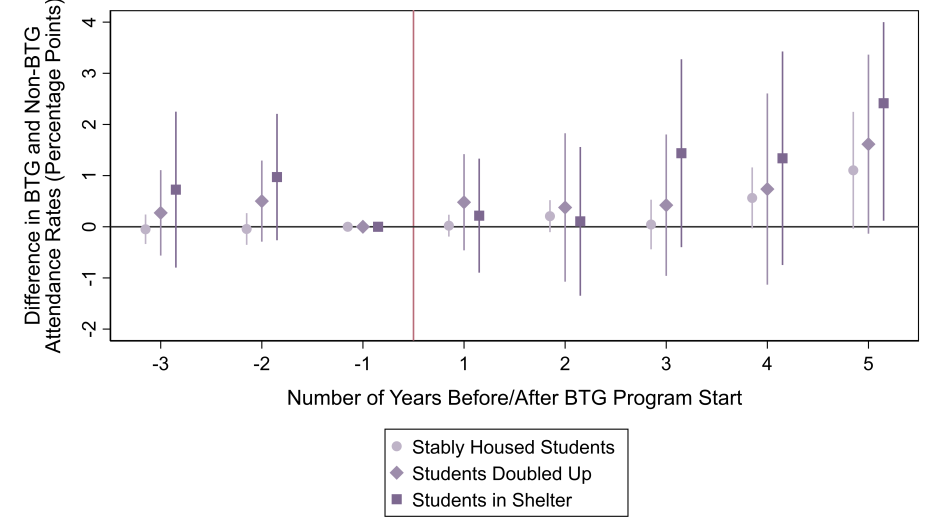
In Figure 1 below, the circle, diamond, and square icons reflect the estimated difference in average attendance rates between BTG and non-BTG schools for each group of students. The vertical lines through the icons reflect the confidence intervals, which is a way of expressing the margin of error in the analysis (when the confidence interval crosses 0, the estimate is not statistically significant). [4] Along the x axis, we display the year relative to the first year a school received the BTG program (with 1 indicating the first year a school received BTG funding).
Figure 1: BTG Program and Attendance Rates

Note: Vertical lines reflect 95% confidence intervals for our estimates.
While there were some differences in attendance rate trends between BTG and non-BTG schools before the program was implemented, these differences were not statistically significant. Attendance outcomes looked quite similar in BTG and non-BTG schools in the first and second years of BTG's implementation, but larger differences emerged in years three through five, particularly for students in shelter. Our findings show that BTG was associated with improved attendance rates for these students after the program had been in place for at least three years. The largest difference was in year five, when we found a statistically significant 2.4 percentage point increase in the average attendance rate of students in shelter relative to similar students who did not attend schools with a BTG social worker. This is equivalent to attending an additional four days of school during that year. [5]
Averaging across all years in which BTG was implemented, we found a 1.2 percentage point difference in the average attendance rate of students in shelters in BTG schools, which is equivalent to two additional days of school per year. Average differences in the attendance rate for doubled-up students in BTG schools were smaller (0.5 percentage points) and not statistically significant. Differences in the attendance rate for stably housed students were smaller still (0.3 percentage points), which is unsurprising, since these students were probably not directly served by the BTG social workers.
There are some limitations to our analysis. We define BTG schools as schools that get funding for a BTG social worker, but do not actually know when or if the schools hired the BTG social worker. We also do not have data on how these BTG social workers were used in schools, which may have varied widely (for example, some may have spent more time on mental health services, while others focused more on community partnerships; caseloads for clinical work also may have differed). In addition, since we measure school-level outcomes, it is possible that our estimates are affected by changes in school population, rather than capturing average effects on individual students.
In summary, our findings provide suggestive evidence that the BTG program—which placed social workers in schools with high portions of students in shelter, specifically to support these students—measurably improved their attendance. This is particularly meaningful given the extent to which homeless students typically struggle with attendance, as well as the recent rise in chronic absenteeism for students across the board.
Big Questions
- We do not know if or when social workers were hired (and/or turned over) in the schools that received BTG funding. In addition, until the 2019-2020 school year, funds for BTG social workers were approved on a year-to-year basis. It is possible that the uncertain funding stream made it challenging for schools to hire social workers, or resulted in greater turnover. Were BTG social workers more effective in schools that had social workers in place for longer periods of time? Were they more effective after the funding stream was more secure?
- It would also be helpful to examine the relationship between program implementation and impacts. For example, were there larger impacts in schools that had a more experienced social worker and/or in schools where the social worker had lower caseloads?
- Why might the BTG program have been successful at increasing student attendance rates? Was it because of the relationships they formed with students or the mental health support these social workers provided? Was it because BTG social workers helped students’ families to access needed assistance? Was it some combination of these and perhaps other factors?
- Other research on social workers in schools has found impacts on outcomes, such as increased mental health service use. To what extent did the BTG program affect other student outcomes not measured in our study? Future work could examine, for instance, whether BTG influenced health or mental health outcomes, disciplinary actions, students’ sense of connectedness to school, or academic achievement.
This post was authored by Kailtyn G. O’Hagan (koh210@nyu.edu) and Zitsi Mirakhur (zitsi.mirakhur@uky.edu), with Chelsea Farley. For more detailed findings, please see Staffing Interventions to Support Students Experiencing Homelessness: Evidence from New York City.
Endnotes
[1] The federal McKinney-Vento Act defines students experiencing homelessness as students who lack a fixed, regular, and adequate nighttime residence.
[2] The difference-in-differences estimation controls for time-invariant school characteristics (i.e. the analysis includes a school fixed effect). In addition, we include controls for: total enrollment, percent of students who were doubled-up, percent of students in shelter, percent of students with disabilities, percent eligible for free or reduced-price lunch, percent English language learners, percent of students by race (Latinx, Black, Asian, and other race), a set of indicators for grade span (K-5, 6-8, K-8, or other), average median household income, pupil-teacher ratio, average teacher experience, an indicator for whether a school has a social worker, and an indicator for whether a school is a community school.
[3] We omitted 2020-2021 from our analysis, since attendance data were collected inconsistently that year due to the COVID-19 pandemic. Attendance for the 2019-2020 school year reflects September 2019-March 2020–before COVID-19-related disruptions.
[4] Our estimates are imprecise because it is a school-level analysis.
[5] Our estimation of four additional days of school attended assumes a 180-day school year.
Suggested Citation
O’Hagan, K. G. & Mirakhur, Z., with Farley, C. (2024). “Do ‘Bridging the Gap’ Social Workers Improve Attendance for Students Experiencing Homelessness?” Spotlight on NYC Schools. Research Alliance for New York City Schools.

