

In our last Spotlight post on school segregation, we showed how different definitions provide very different pictures of segregation across NYC. Schools that appear “racially representative” when compared to their Community School District (CSD), for example, can be racially isolated when compared to their borough or the City as a whole. These differences are important, as they highlight the multiple levels at which segregation and inequality play out, each of which may require different policy responses.
In this Spotlight post, we use maps to show where racially representative elementary and middle schools in NYC are located, following the three definitions from our previous post. This analysis includes both traditional district schools and charters. Figure 1 shows racially representative schools based on their concentration of Black and Latino students (i.e., representative schools have no fewer than 50 percent and no more than 90 percent Black or Latino students). Figures 2 and 3 show racially representative schools based on a comparison of their racial demographics with those of their CSD or borough, respectively.[1]
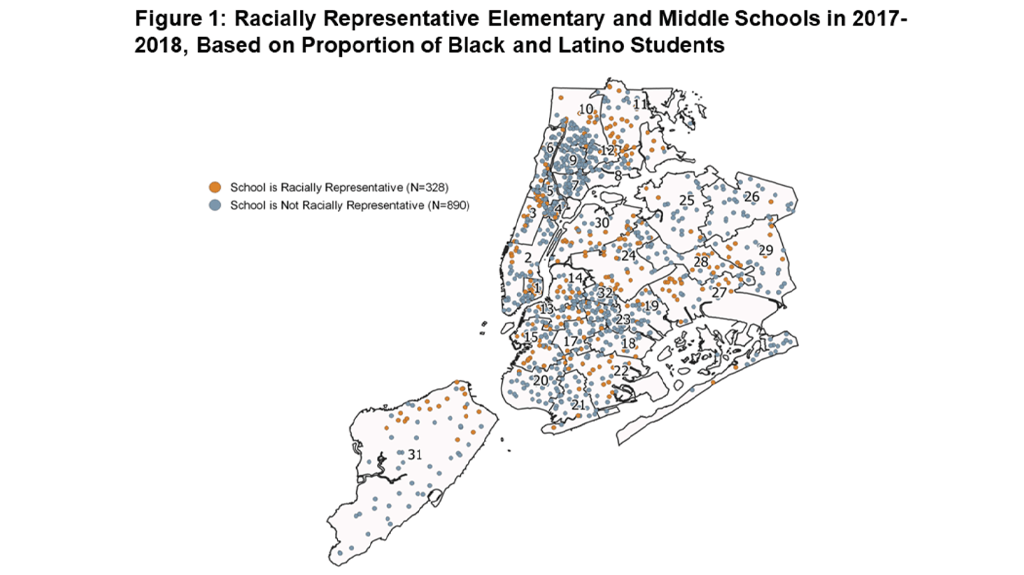
Schools that are racially representative according to the first definition are found in many CSDs across the City (Figure 1). By this measure, the five CSDs with the highest proportions of racially representative schools are CSD 1 (58 percent), which includes the Lower East Side and Chinatown in Manhattan; CSD 13 (48 percent), which includes Brooklyn Heights and Fort Greene in Brooklyn; CSDs 24 (51 percent) and 30 (52 percent), which include the Ridgewood and Elmhurst, Astoria, and Jackson Heights neighborhoods in Queens; and CSD 11 (48 percent), which includes the Pelham Parkway and Woodlawn neighborhoods in the Northeastern Bronx. A distinguishing feature of these CSDs is that they enroll a sufficiently high proportion of White and/or Asian students to limit the concentration of Black and Latino students in any one school. In contrast, there are few racially representative schools in CSDs such as 7, 9, and 10 in the Bronx, where the student population is largely Black or Latino.
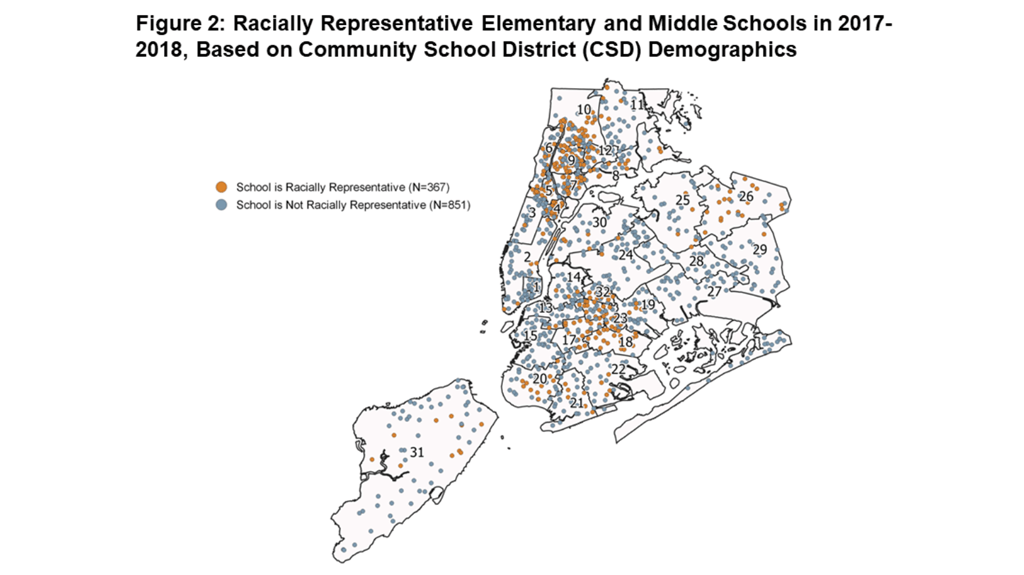
The location of racially representative schools changes when we adopt a definition that compares schools to their CSD (Figure 2). In this case, racially representative schools are clustered in CSDs in which the student population is relatively homogeneous. These include CSDs 4 and 5 in northern Manhattan, CSDs 7, 9, and 10 in the Bronx, and CSDs 16, 17, 18, 20, 23, and 26 in Brooklyn. The five CSDs with the highest proportions of racially representative schools are CSD 7 (64 percent), which includes the Mott Haven neighborhood in the South Bronx; CSDs 17 (67 percent), 18 (96 percent), and 23 (65 percent), which include the Prospect Heights, Crown Heights, Flatbush, Brownsville, and East New York neighborhoods in Brooklyn; and CSD 4 (62 percent), which includes the East Harlem neighborhood in Manhattan.
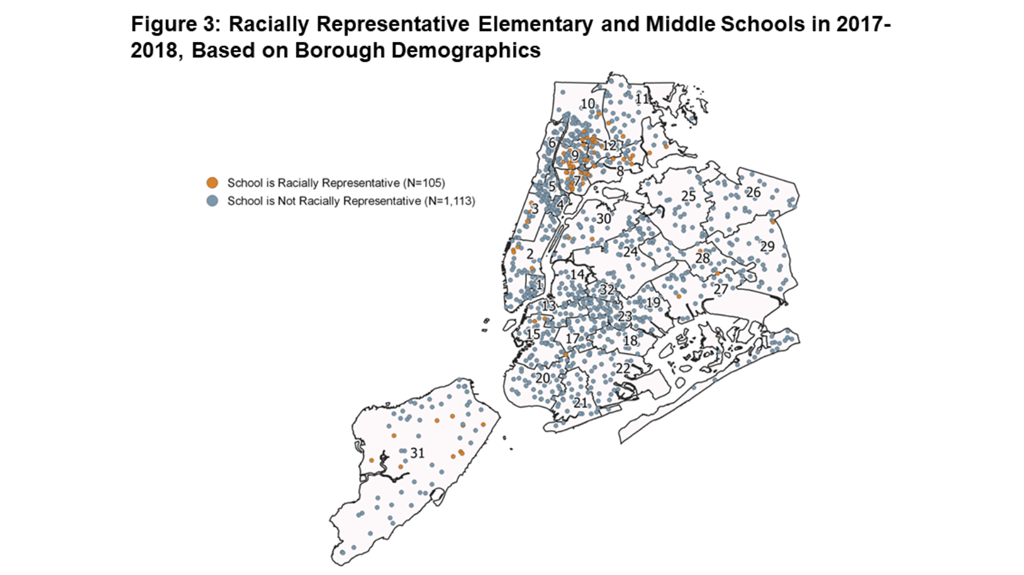
Finally, Figure 3 shows that very few schools can be considered racially representative when compared to their borough. Those that are considered racially representative by this definition are located primarily in the South Bronx, where schools are heavily Black and Latino. Nearly two thirds of the racially representative schools by this definition are located in CSDs 7, 8, 9 and 12 in the South Bronx—68 out of 105 schools citywide. Notably, only 3 schools in Brooklyn, 6 schools in Queens, and 9 schools in Manhattan are racially representative when compared to the demographics of their borough.
Big Questions:
The maps in this Spotlight post show how the picture of “racial representativeness” shifts depending on the point of comparison and the degree of residential segregation seen within and between communities. These maps also clearly illustrate the difficulty of achieving racially representative schools that reflect the diversity of New York City as a whole. This would likely require massive shifts in patterns of residential segregation or requiring students to attend school very far from home. That said, there may be changes to enrollment policies or practices that could have an immediate impact on school demographics in some communities and move more schools in the direction of reflecting the City’s diverse population. In future work, we hope to address topics that can help us answer questions like the following:
- What does racial representation look like at the high school level, where students have more flexibility to choose schools across the City?
- To what extent does academic screening (within and across districts) play a role in racial and ethnic segregation? How will policies to limit screening at the middle school level, like those underway in CSDs 3 and 15, affect racial representation?
- How closely linked are neighborhood and school segregation? Put differently, are there CSDs that are highly residentially segregated but have schools that are racially representative of the district? Conversely, are there CSDs with diverse populations but highly segregated schools? To what extent do these different scenarios require different policy responses?
What else should we be asking about mapping racially representative schools? Let us know via email.
This post was authored by Kathryn Hill, Zitsi Mirakhur, and John Sludden. Special thanks to Sean Corcoran for his generous feedback on earlier drafts of this work.
Footnotes
[1] For more details about these definitions, see our previous post.
How to Cite this Spotlight
Hill, K., Mirakhur, Z., Sludden, J. 2019. "Mapping Racially Representative Schools." Spotlight on NYC Schools. Research Alliance for New York City Schools.