While a growing number of initiatives around the country are focused on expanding access to computer science (CS) education, the inclusion of students with disabilities has received little attention in such initiatives.[i] In fact, as a field, the K-12 CS education community has been reluctant to track the participation of students with disabilities in CS education initiatives.[ii] The few studies that examine students with disabilities do so in aggregate, which masks differences by grade level and disability classification.[iii] These factors have limited our understanding of the extent to which students with disabilities are included in K-12 CS education. Information about CS participation by grade level and disability category is particularly important to inform meaningful decisions about pedagogical approaches that can meet the needs of all students in K-12 CS education.
This Spotlight post uses data on students’ Individualized Education Plans (IEPs) and CS course enrollment records from the 2018-2019 school year to explore students’ participation in CS education across grade bands. It is important to note that the analyses below include only students who attend public schools in one of NYC’s 32 community school districts. They do not include students who attended alternative high schools or charter schools, or students who are served in District 75, a special district in the City that serves students with low-incidence disabilities[iv] or highly specialized needs.
NYC Context
In 2016, New York City, like many districts and states around the country, responded to the call for K-12 CS education with a Computer Science for All initiative. The initiative’s central goal is to ensure that all public school students—especially female, Black, and Latinx students (who historically have been underrepresented)—learn computer science. Specifically, the initiative aims to provide at least one meaningful and high-quality CS experience in each grade band: Kindergarten to 2nd grade, 3rd through 5th grade, 6th through 8th grade, and 9th through 12th grade.
Through the initiative, schools are encouraged to implement CS instruction in a way that aligns best to their educational vision. At the elementary level, 16- to 20-hour CS units are incorporated into core subject areas (e.g., science, mathematics, social studies, English language arts) or classes like art, music, or technology. At the middle and high school level, CS can be a semester course, a multi-year sequence, or incorporated into other content-area courses (e.g., science, math, art). Thus, students’ CS experiences may vary widely, ranging from a 16-hour integrated unit that engages K-2nd graders in remixing and creating visual media, to a 54-hour introductory project-based course that uses Scratch programming for middle school students, to a 108-hour advanced placement course for 10th to 12th graders.[v] The analyses below include participation in any of these types of CS experiences.
As part of the Research Alliance’s evaluation of the CS4All initiative, we have been examining progress toward equitable CS participation in NYC schools. Promisingly, since the initiative began, there have been year-by-year increases in the number of schools offering and students taking CS courses, including a steady rise in Black, Latinx, and female student participation. Further, we have seen a four-fold increase in the participation of students with disabilities (from 4% to 16%) between 2016 and 2020 (see, for example, these reports). We hope the analyses below are useful to educators and district leaders, as they continue working to expand access to CS education in NYC schools.
Key Findings
Overall, NYC students with disabilities participate in K-12 CS education at rates similar to their peers.
Across the City, nearly 18 percent of all students in grades K through 12 took at least one CS course in 2018-19. Among the students who took CS, 14 percent had an IEP, making them eligible to receive special education services. This is similar to the proportion of all students in the district with an IEP (15.1%). Thus, in aggregate, students receiving special education services appear to participate in K-12 CS education at levels similar to their peers without IEPs.
Notable differences emerge when we disaggregate CS participation data.
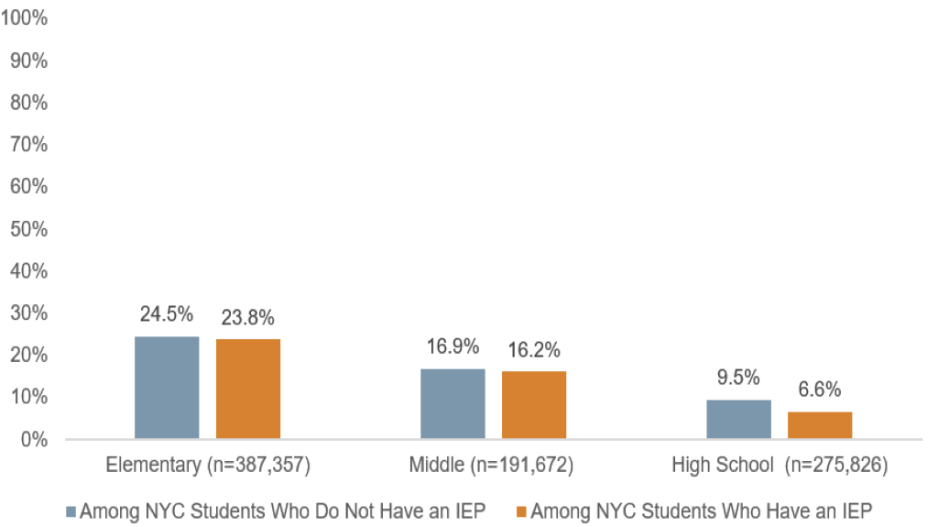
Among all students, there are large grade-level differences in who participated in CS. Nearly a quarter of elementary students without an IEP took a CS course (24.5%). In comparison, only about 17 percent of middle schoolers without an IEP and a little over 9 percent of high school students without an IEP took a CS course (see the blue bars in Figure 1 below).
When we look specifically at students with IEPs (the orange bars), we see that participation rates in elementary and middle school were nearly identical to the larger population. However, in high school, students with disabilities were less likely to participate in CS education (6.6% versus 9.5%). Thus, the seemingly equal representation of students with IEPs in CS courses is largely driven by participation at the elementary and middle school levels. This may be due to the fact that, in the elementary and middle grades, CS is often integrated into core subjects that all students take. At the high school level, students are more likely to take stand-alone CS courses, which they often have to opt into. High schools are also more likely to offer advanced CS courses (such as Advanced Placement courses), which may influence who takes CS. Further investigation is needed to understand what is driving the disparities that emerge at the high school level.
Figure 1: Percent of Students Who Took CS at Each Grade Level

Source: Research Alliance calculations based on data obtained from the NYC Department of Education.
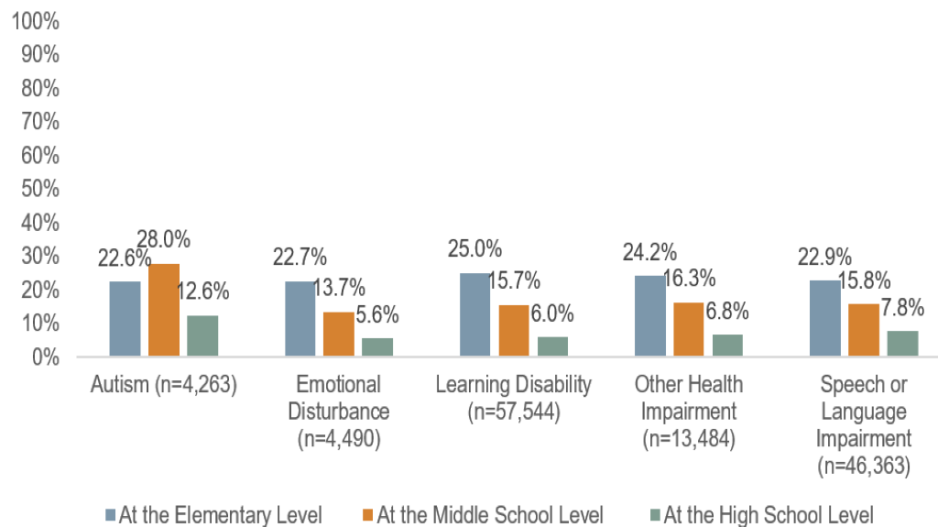
These findings become even more complex when we examine students receiving special education by both grade level and disability category. As shown in Figure 2, for most disability categories (i.e., learning disability, emotional/behavioral disorder, other health impairment, and speech/language impairment), there was a marked decrease in CS participation from elementary to middle to high school. For example, 25 percent of elementary students with a learning disability (who represent the largest category of students in special education) took a CS course, compared with 16 percent of their peers in middle school and 6 percent of their peers in high school. While the rates for elementary and middle school students with learning disabilities were similar to those for all students in the district, the percent of high school students with a learning disability lagged the districtwide CS participation rate by a third. This disparity is worth examining further, especially since students with learning disabilities are typically taught in general education settings alongside their peers.
The trend is slightly different for students with autism. These learners have similar participation at the elementary level, but participation at the middle school level increases. Similar to their peers with other types of disabilities, CS participation for students with autism decreases in high school, but the decline is not as steep. The reasons—for both the general patterns seen in these data, as well as for the differences for students with autism—are unclear, but knowing that these patterns exist is a starting point for examining the underlying causes.
Figure 2: Percent of Students Who Took CS Within Specific Disability Categories

Source: Research Alliance calculations based on data obtained from the NYC Department of Education.
Big Questions
These findings reflect only the beginning of the work needed to understand the participation of students with disabilities in K-12 CS education. The literature points to many possible reasons for differences in opportunities among students with and without disabilities, including institutional and teacher bias in perceptions of who should take CS, as well as lack of teacher supports and resources to effectively serve students with diverse needs.[vi] In addition, students with disabilities may have more difficulty fitting CS courses into their schedule alongside needed services such as speech, occupational, or physical therapy. The current findings raise a number of key questions that we will be exploring in our future work, including:
- What factors influence CS participation for students with disabilities? For example, to what extent is participation influenced by attitudes and perceptions about who CS is for?
- What is the relationship between CS participation, disability status and other demographic factors such as race/ethnicity, socioeconomic status, and gender? Are the disparities we see in CS participation among general education students also present among students with disabilities?
- Is the participation of students with disabilities in K-12 CS education related to school-level factors such as neighborhood/school SES, the percentage of students with disabilities in the school, the percentage of students with disabilities served in inclusive or self-contained settings, or the number of computer science classes offered in the school?
- What types of CS classes are students with different disabilities taking? For example, at the high school level, are students with disabilities represented in Advanced Placement CS classes?
This post was authored by Cheri Fancsali and Maya Israel (Educational Technology, The Creative Technology Research Lab, University of Florida), with analytic support by Zitsi Mirakhur and Ethan Crasto. The analyses were conducted as part of our ongoing study of the NYC CS4All initiative, in which the Research Alliance is answering important questions about the implementation and impact of the initiative for NYC students, schools, and teachers. The study is supported by the Fund for Public Schools.
Footnotes
[i] Bouck, E. C., Sands, P., Long, H., & Yadav, A. (2021). “Preparing Special Education Preservice Teachers to Teach Computational Thinking and Computer Science in Mathematics.” Teacher Education and Special Education, 0888406421992376.
Ladner, R. E., & Israel, M. (2016). “ ‘For all’ in ‘computer science for all’.” Communications of the ACM, 59(9), 26-28.
[ii] Blaser, B., & Ladner, R. E. (2020, March). “Why is Data on Disability So Hard to Collect and Understand?” In 2020 Research on Equity and Sustained Participation in Engineering, Computing, and Technology (RESPECT) (Vol. 1, pp. 1-8). IEEE.
[iii] Code.org, CSTA, & ECEP Alliance. (2020). 2020 State of Computer Science Education: Illuminating Disparities. Retrieved from https://advocacy.code.org/stateofcs.
[iv] Low-incidence disabilities are visual or hearing impairments, significant cognitive impairments, or “any impairment for which a small number of personnel with highly specialized skills and knowledge are needed in order for children with that impairment to receive early intervention services or a free appropriate public education” (IDEA section 1462 (c) https://sites.ed.gov/idea/statute-chapter-33/subchapter-IV/part-B/1462/c)
[v] See https://blueprint.cs4all.nyc/curriculum/ for a description of CS4All’s K-12 curriculum.
[vi] Kirby, M. (April, 2017). Implicit assumptions in special education policy: Promoting full inclusion for students with learning disabilities. In Child & Youth Care Forum (Vol. 46, No. 2, pp. 175-191). Springer US.
How to Cite this Spotlight
Fancsali, C., Israel, M. 2021. "To What Extent are Students With Disabilities Included in K-12 Computer Science Education?" Spotlight on NYC Schools. Research Alliance for New York City Schools.

