

The total size of the homeless student population in NYC is growing. In the 2012-2013 school year, for example, there were 34,120 homeless elementary students; in 2017-2018, this number had increased to 44,010.[1] In our recent brief on young students who experience homelessness, we found that homeless students were not evenly distributed across the system. Although most elementary schools in the City serve some homeless students, the percentages ranged from very low (less than 1 percent) to substantial (40 percent or more in some cases).
These differences matter because the work of supporting homeless students falls most heavily on staff in schools with the highest concentration of these vulnerable youngsters. For this reason, it is important to understand if the number of schools serving disproportionately high rates of homeless students has increased over time. We decided to find out if this is in fact the case.
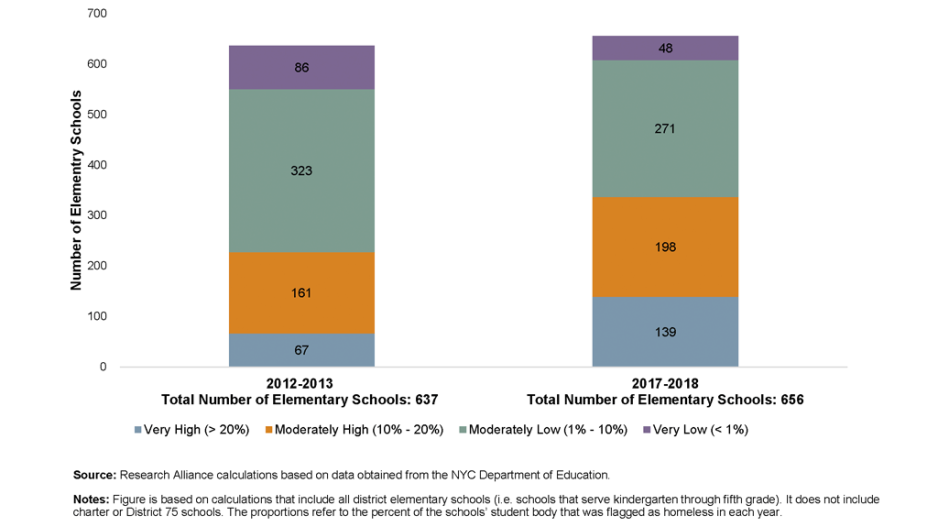
For this analysis, we divided NYC elementary schools into four groups, based on the proportion of homeless students they served, in the 2012-2013 school year and the 2017-2018 school year. Figure 1 shows how the number of elementary schools serving different concentrations of homeless students changed during this time. We found that, indeed, the number of elementary schools that serve high concentrations of homeless students has increased. In the 2012-2013 school year, 67 schools served a very high proportion of homeless students (more than 20 percent of the student body), a number that more than doubled—to 139 schools—in the 2017-2018 school year. Similarly, the number of schools that serve a moderately high proportion of homeless students (between 10 and 20 percent of the student body) also grew. Meanwhile, the number of schools that serve low concentrations of homeless students shrank during this time. The number of schools serving a moderately low proportion of homeless students (between 1 and 10 percent of the student body) dropped from 323 to 271, and the number of schools serving a very low proportion (less than 1 percent of the student body) dropped from 86 to 48.
Figure 1: How Has the Number of Elementary Schools Serving Different Concentrations of Homeless Students Changed Over Time?
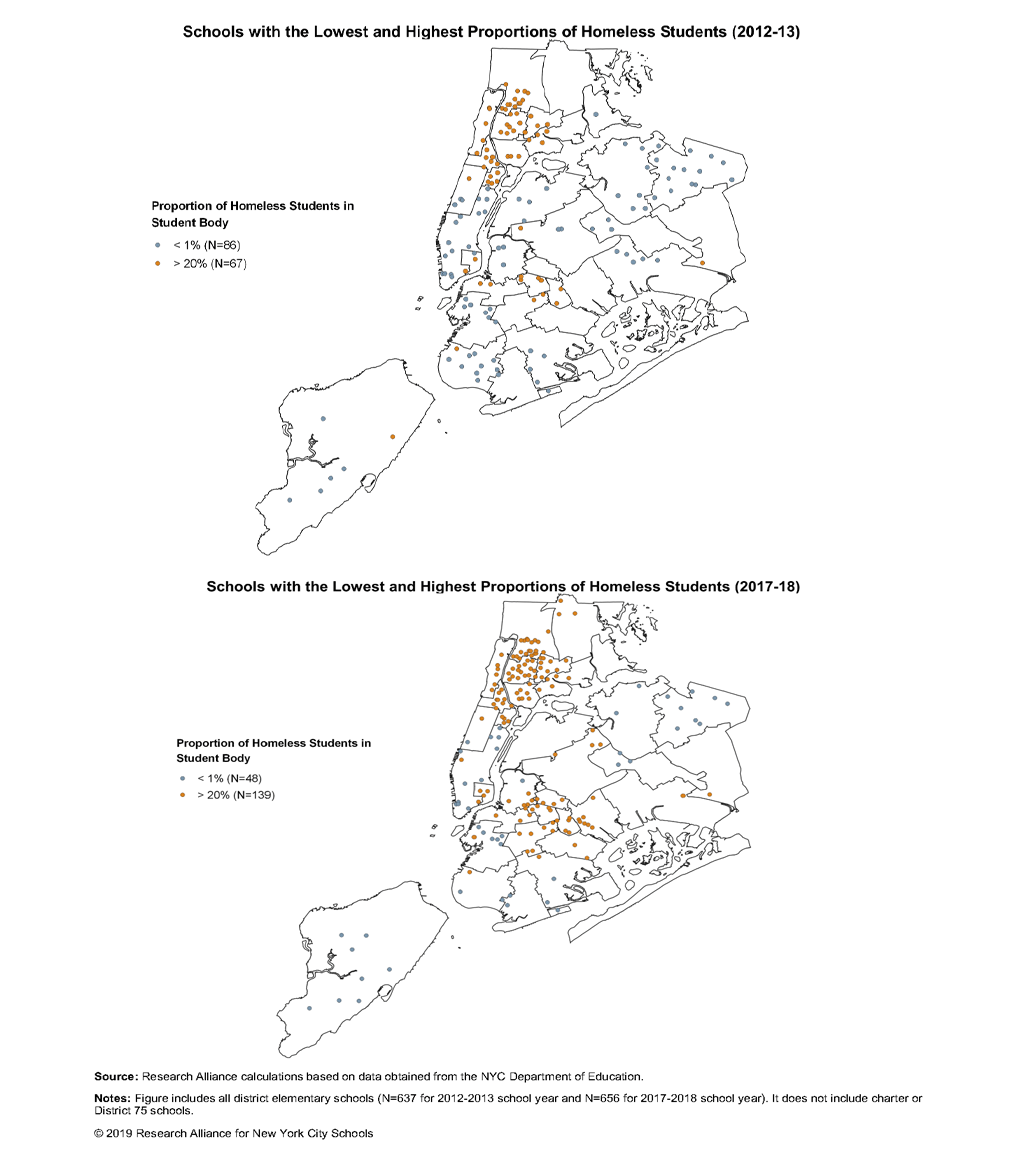
The maps in Figure 2 (below) show the location of the elementary schools with very low and very high proportions of homeless students in the 2012-2013 and 2017-2018 school years. Not surprisingly, schools with the highest concentrations of homeless students tended to be located in the City’s poorest communities, including neighborhoods in Harlem, Washington Heights, the South Bronx, and Central Brooklyn. The schools with the lowest proportions of homeless students were clustered in more affluent areas of the city, including neighborhoods in mid and lower Manhattan, the South Slope of Brooklyn, and Northwestern Queens.
Figure 2 also depicts the dramatic increase in schools serving high concentrations of homeless students between 2013 and 2018. Our previous study highlighted a number of challenges in serving homeless students—including identifying them, coordinating services with external providers, addressing social and emotional needs, and working to promote regular school attendance. These fall disproportionately on schools with large numbers of homeless students. In recognition of this, the New York City Department of Education (NYC DOE) has recently rolled out several initiatives aimed at supporting these schools. This has included the development of data tools to coordinate efforts between shelters and the DOE, and the expansion of strategies used in Community Schools in an effort to improve student attendance. It has also included the hiring and placement of coordinators in schools to help organize support services for homeless students.
Figure 2: Where Are the Schools That Serve the Highest and the Lowest Proportions of Homeless Students?
Big Questions:
These findings raise a number of important questions for future study, including:
- What kinds of programs and practices best support homeless students in schools with different concentrations of these students? Our past research focusing on schools with the highest proportions of homeless students found that such schools can often become sites of targeted service provision to support the academic—but also social-emotional, health, and basic needs—of homeless students. Would the strategies for supporting homeless students look different in schools with fewer of them?
- What should be done about the uneven distribution of homeless students across schools? This is tied to citywide conversations about economic and racial segregation (e.g., District 1’s new diversity plan has an explicit focus on the representation of homeless students in its schools). To what extent will new desegregation initiatives produce a more even mix of homeless students across schools? Will homeless students’ needs be met more or less effectively in integrated educational settings?
What else should we be asking about student homelessness in NYC Schools? Let us know via email.
This post was authored by Kathryn Hill and Zitsi Mirakhur.
Footnotes
[1] We do not include students enrolled in District 75 or 88 schools, or students enrolled in charter schools in this calculation.
How to Cite this Spotlight
Hill, K., Mirakhur, Z. 2019. "Where are NYC Schools Serving the Highest Concentrations of Homeless Students?" Spotlight on NYC Schools. Research Alliance for New York City Schools.