The fourth in a series exploring indicators of equity in NYC schools as part of the COVID-19 and Equity in Education Project, which is supported by the Bill & Melinda Gates Foundation and the AIR Equity Initiative.
As part of our ongoing series, this post examines an important indicator of opportunity for NYC high school students: their access to a positive school climate. To emphasize differences that have practical implications for students’ experiences moving through the school system, the post focuses on schools with the highest and lowest average perceptions of climate, based on the composite measure that we introduced in our previous post. This composite is made up of responses to five items that have been used consistently in recent iterations of the survey. These items deal with the prevalence of bullying in the school, safety in classrooms, academic engagement, trust in adults, and cultural respect.
As in our post on access to advanced coursework, this analysis of school climate examines differences by race/ethnicity and neighborhood poverty, both between and within schools. Focusing on school-level averages of the school climate composite measure (based on the responses of first-time 9th graders in NYC public schools in the 2014-2015 and 2015-16 school years), we begin by examining enrollment in schools with the highest and lowest perceptions of school climate (i.e., top 10 percent and bottom 10 percent). Next, we look more closely at three groups of schools (i.e., top 10 percent, middle 80 percent, and bottom 10 percent) to assess how students with different background characteristics vary in their perceptions of the climate within schools that have similar school-wide averages.
How equitable is student access to a positive school climate?
As shown in Figure 1, there are striking differences in the racial and ethnic makeup of schools with the highest and lowest perceptions of school climate. About 11 percent of the City’s Black students were enrolled in schools with the lowest perceptions of school climate, while just 5 percent were enrolled in the schools with the highest perceptions of climate. Conversely, only 2 percent of the NYC’s White students and 3 percent of Asian students were enrolled in the lowest-ranked schools, but 13 and 15 percent, respectively, were enrolled in the schools with the highest rankings of school climate.
Figure 2 shows differences in enrollment in these schools by neighborhood poverty. The percentage of students from high-income neighborhoods in the highest rated climate schools is particularly striking. Otherwise, the differences are somewhat less pronounced than for race/ethnicity.
Looking at the two sets of figures together, it is clear that Black and low-income students are overrepresented in schools with the worst perceptions of school climate, while Asian, White and high-income students are overrepresented in schools with the best perceptions of school climate.
Figure 1: Share of NYC’s Asian, Black, Latinx and White 9th Graders Who Attend Schools With the Highest and Lowest Perceptions of School Climate
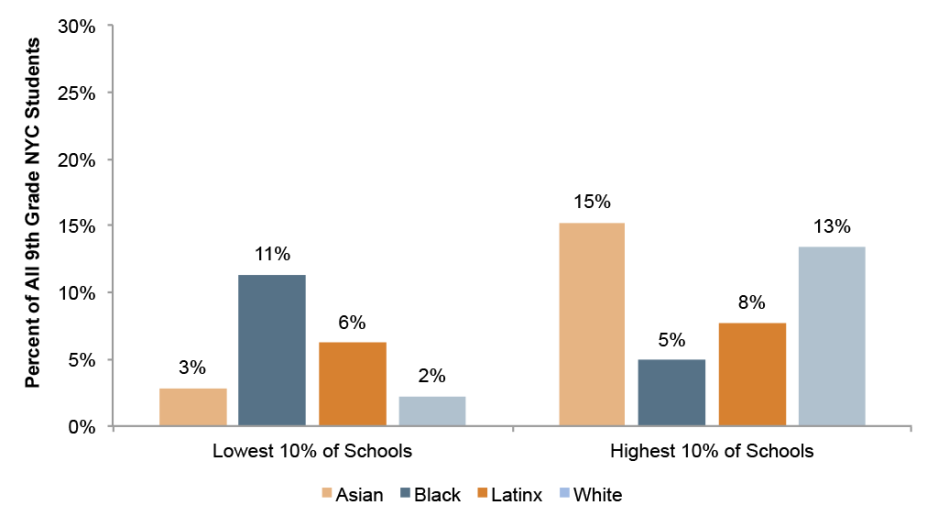
Figure 2: Share of NYC’s Low-, Mid- and High-Income 9th Graders in Schools with the Highest and Lowest Perceptions of School Climate
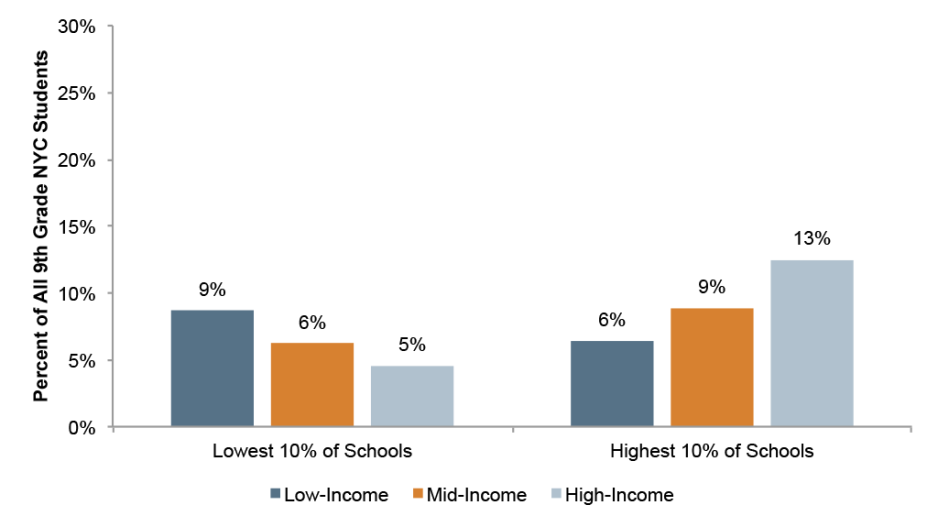
Figure 3 shows differences by race/ethnicity within each of the school climate groups in relation to the citywide average (represented as zero in the figure). Here we see that students’ perceptions were generally consistent within school groups, with students of all races/ethnicities in the lowest-ranked schools reporting lower perceptions, and those in the highest-ranked schools consistently reporting better perceptions. In spite of these overall patterns, Black and Latinx students in the lowest-ranked schools had notably more negative impressions of the climate there than their White and Asian peers within the same group. Black students also had substantially lower perceptions of the school climate in the other two groups of schools, including the middle 80 percent that make up the vast majority of schools in the system.
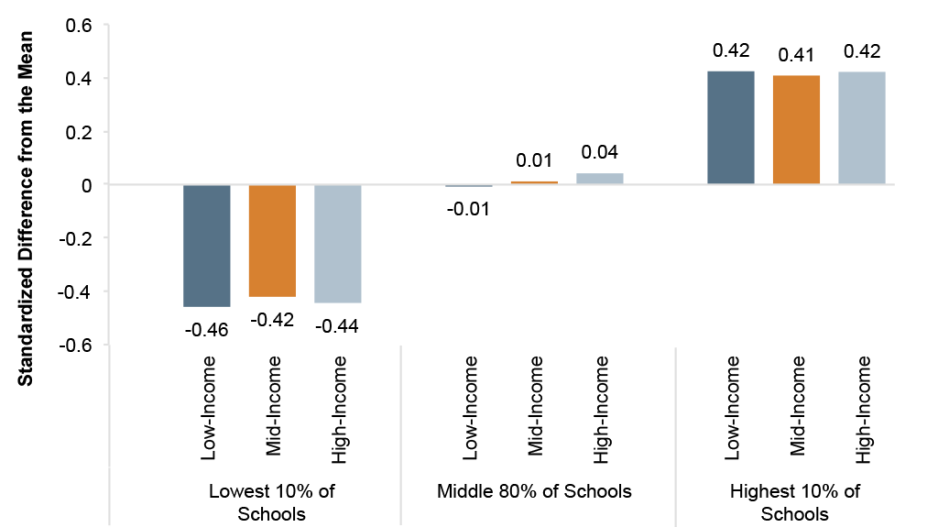
By contrast, as shown in Figure 4, there were few differences associated with students’ residential neighborhood poverty within each of the three school climate groups. All students in each category reported relatively similar perceptions of the climate.
Figure 3: Average Perception of Climate by Students’ Race/Ethnicity and School Climate Group
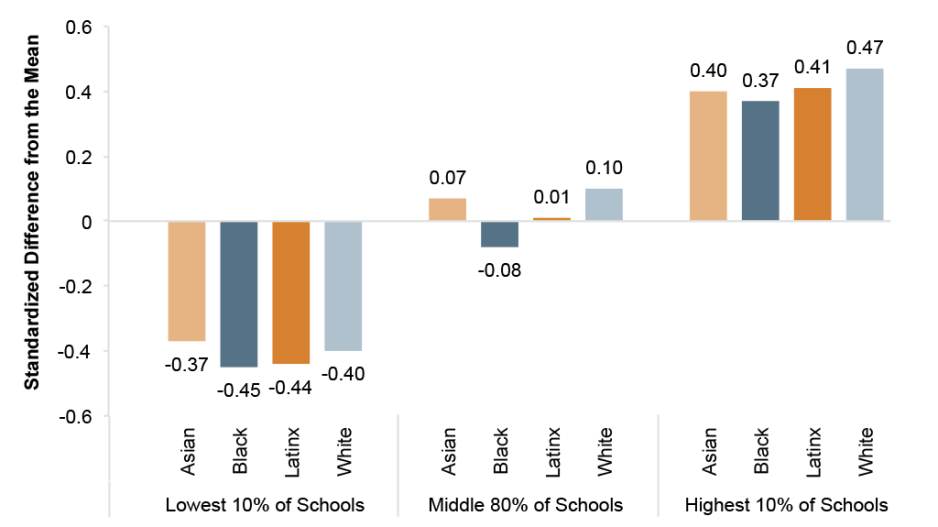
Figure 4: Average Perception of Climate by Students’ Neighborhood Poverty and School Climate Group
These patterns suggest two major findings that have bearing on policy and practice in New York City. First, students from the lowest-income neighborhoods and Black students are disproportionately enrolled in schools with lowest climate scores and disproportionately underrepresented in schools with the highest scores (Figures 1 and 2). The magnitude of these differences is larger based on students’ race/ethnicity than for levels of poverty in students’ home neighborhoods. Second, for Black students, in particular, the experience of school climate is more negative in all school groups, including the 80 percent of high schools that serve the bulk of the City’s students (Figure 3). In both cases, these facts suggest that access to a positive school climate is primarily a problem of racial equity (not just poverty). Addressing this problem will require changes on at least two fronts: improving the lowest-ranked schools where Black students are disproportionately enrolled and ensuring that all schools are equipped to better serve and support their Black students.
Big Questions
-
Do these patterns change over time? Has the COVID-19 pandemic fundamentally shifted how school climate is perceived and whether students are able to access schools where perceptions are more positive? We plan to investigate these disparities over time, looking at more recent years of data, to understand whether these patterns have persisted and whether students’ perceptions of school climate have changed in the years following the COVID-19 pandemic.
- What practices can we learn from schools with the most positive school climate? What changes could be made by schools with the most negative climates? In future work, we hope to examine some of the characteristics of schools with the most negative and positive school climates. Qualitative research could provide useful insight into the specific strategies being used in schools that students perceive most positively.
This post was authored by Spenser Gwozdzik and Kristin Black (December 2022).
Figure Notes
Source: Research Alliance calculations based on data obtained from the NYC Department of Education.
Notes: Calculations based on the school-level averages of school climate composite scores from 9th grade student survey responses in the 2014-15 and 2015-16 school years (N= 99,649).
How to Cite this Spotlight
Gwozdzik, S., Black, K. 2022. "How Equitable is Access to a Positive School Climate in NYC Schools? Part 2." Spotlight on NYC Schools. Research Alliance for New York City Schools.

