This post is the third in a series exploring indicators of equity in NYC schools as part of the COVID-19 and Equity in Education Project, which is supported by the Bill & Melinda Gates Foundation and the AIR Equity Initiative.
In this post, we turn to perceptions of school climate in New York City’s high schools. Research has found that positive school climate is correlated with a wide array of health and academic performance outcomes and is therefore an essential resource, or opportunity, for student development. [1] Information about disparities in how students perceive their schools and classrooms can inform efforts by educators, school leaders, and policymakers to create conditions that put all students on a path to success.
School climate is a multidimensional construct without a single, universal definition. This analysis explores student survey responses related to key dimensions of school climate that have been outlined by the National School Climate Center, including safety, teaching and learning, and interpersonal relationships. [2]
The analysis focuses specifically on the experiences of students in the 9th grade, which is an important transition year that sets the stage for longer-term academic success. [3] Our data are based on the NYC School Survey responses of 99,694 9th grade students in the 2014-15 and 2015-16 school year [4]— the first years for which survey questions were asked in their current format. The expected graduation date for these cohorts of students fell immediately before and during the COVID-19 pandemic, 2019 and 2020 respectively. These data provide valuable baseline information about perceptions of school climate in NYC high schools prior to the disruptions caused by COVID-19. Future analyses will explore whether these perceptions have shifted notably over time.
Our analysis examines students’ responses to the following five items, which have been used consistently on the Survey since 2014 and which speak to each of the major domains of school climate that we sought to assess:
- Bullying in the School – At this school, students harass, bully or intimidate other students.
- Classroom Safety – I feel safe in my classes at this school.
- Academic Engagement – This school offers a wide enough variety of programs, classes and activities to keep me interested in school.
- Adult Relationships – There is at least one adult in the school that I can confide in.
- Cultural Background – I feel that my teachers respect my culture/background. [5]
Answers to the items ranged from 1 to 4 on a Likert scale, with 1 typically being “Strongly Disagree” and 4 typically being “Strongly Agree.” [6] Student responses were mostly positive, with the median response among students in our sample being a 3, equivalent to a response of “agree.”
How do schoolwide perceptions of climate vary by race?
To measure the degree to which students have equitable access to a positive school climate, we aggregated all responses by school and year to create school-wide average measures of perceptions for each of these five items. As we have found in other analyses of school climate measures, the vast majority of schools have climate ratings somewhere close to the average, with a much smaller number of schools having extremely high or extremely low ratings.
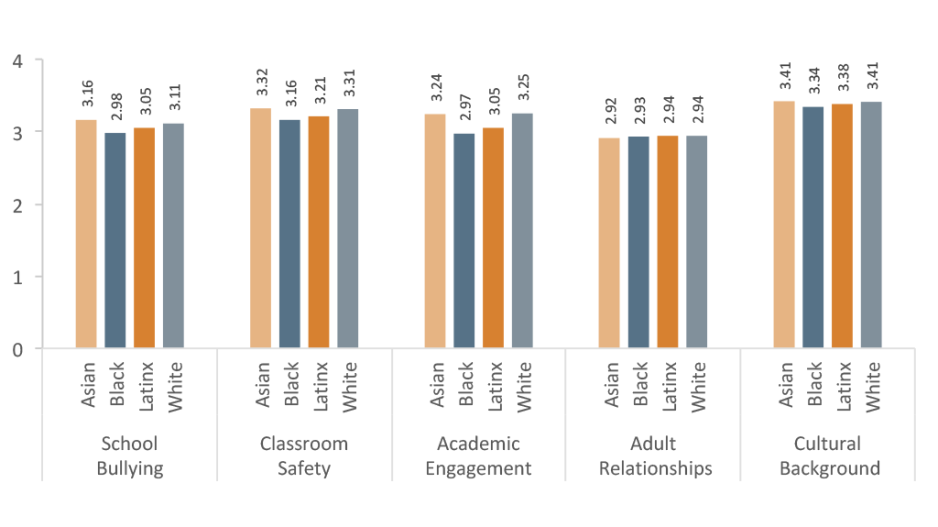
We then examined how students of different backgrounds experience their schools. Figure 1 below reports schoolwide averages for all Asian, Black, Latinx, and White students across the City. Except for Adult Relationships, where average schoolwide perceptions were consistently lower for all students (with an average schoolwide perception of 2.92-2.94 on the 4-point scale), the remaining domains show a consistent pattern of White and Asian students attending schools with better reported perceptions than Latinx students, who in turn attended schools with more positive average perceptions of school climate than Black students.
Figure 1: Average Schoolwide Perceptions of School Climate Items by Race

It can be hard to assess the practical significance of these differences—what should we make, for example, of an average schoolwide rating of 3.32 for Asian students on the classroom safety question, compared to 3.16 for Black students? The difference is relatively small in magnitude but could still represent meaningful inequities in students’ experiences in school. Furthermore, the consistency in differences across multiple domains is quite striking.
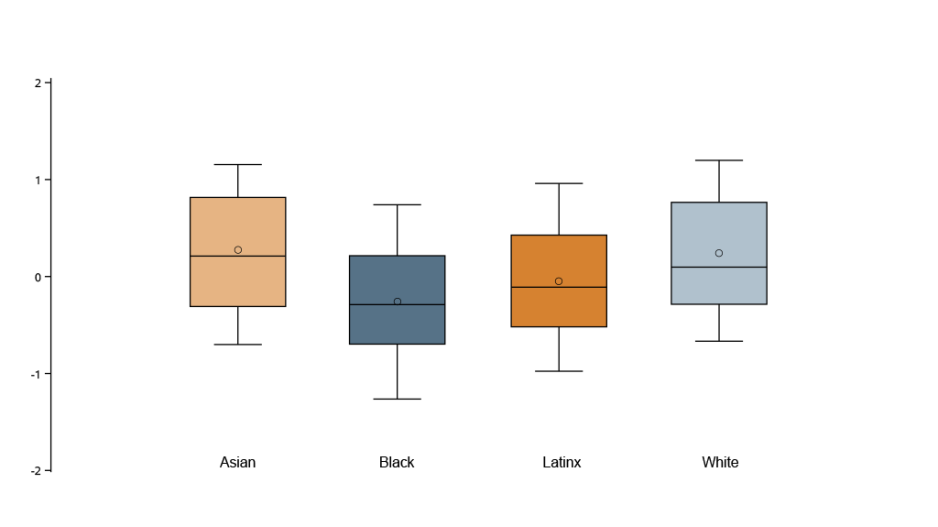
Given this consistency, we developed a composite measure of school climate that averages the ratings for all five of these items, with these values standardized and reported as z-scores. This measure, which we refer to here as Composite School Climate, offers a more concise way to compare school-level perceptions of school climate. [7]
The side-by-side boxplots in Figure 2, below, show the distribution of schoolwide perceptions of climate by race/ethnicity for all students in our sample, with zero representing the citywide average. For each group of students (i.e., Asian, Black, Latinx, or White), the small circle in the box represents the average school for that group, and the central horizontal line shows the median school; the top and bottom lines of the box reflect the 75th and 25th percentiles, respectively. The whiskers indicate how the 90th and 10th percentile schools were rated in terms of their composite climate. The figure demonstrates striking differences in overall experience of school climate by race/ethnicity, with White and Asian students attending schools with generally higher ratings of school climate, and Black and Latinx students attending schools with relatively lower climate ratings. These differences are particularly stark for Black students. The median in schools attended by Asian students, for instance, was rated about .25 on climate, or just above the NYC average. For Black students, by contrast, the school median was rated closer to -.3, below the City average.
Figure 2: Composite Perceptions of School Climate by Race

This analysis provides evidence not only of differences’ in students’ perceptions of school climate by race, but suggests that these differences are driven at least in part by the characteristics of schools that students attend (rather than different experiences in the same schools). Black students, in particular, appear to attend schools with climates that are generally rated much lower than average. Given the documented links between perceptions of school climate and student wellbeing and academic outcomes, these disparities represent a significant cause for concern. In subsequent School Climate spotlight posts, we will dig deeper into the schools at the top and bottom of the distribution of perceived climate to better understand these inequities.
Big Questions
- Which students have access to the schools with the most positive perceptions of school climate? Conversely, are there particular student groups who are overrepresented at the schools with the most negative perceptions of school climate? An upcoming post will begin to explore these questions.
- What school factors or characteristics are associated with notably positive or negative perceptions of climate? We will also explore whether factors such as the student demographic composition or school size are associated with being in the lowest or highest 10 percent of the school climate distribution.
- How do disparities in perceptions of climate vary over time? We plan to investigate whether the schools with the most and least positive perceptions of climate have changed meaningfully in recent years, including looking into the impact of the COVID-19 pandemic.
This post was authored by Spenser Gwozdzik and Kristin Black (December 2022).
Figure Notes
Source: Research Alliance calculations based on data obtained from the NYC Department of Education.
Notes: Calculations include school climate survey responses from students who were enrolled in 9th grade in 2014-15 and 2015-16 school years (N=.99,649).
Endnotes
[1] For example, see the literature review of Cohen, J., McCabe, L., Michelli, N. M., & Pickeral, T. (2009). School climate: Research, policy, practice, and teacher education. Teachers College Record, 111(1), 180-213. Or more recent studies such as Daily, S. M., Mann, M. J., Lilly, C. L., Dyer, A. M., Smith, M. L, & Kristjansson, A. L. (2020). School climate as an intervention to reduce academic failure and educate the whole child: A longitudinal study. Journal of School Health, 90 (3), 182-193.
[2] National School Climate Center. (2020). The 14 Dimensions of School Climate. For a discussion of recommendations and policy implications, see also: NSCC. (2007). The School Climate Challenge: Narrowing the Gap Between School Climate Research and School Climate Policy, Practice Guidelines and Teacher Education Policy.
[3] For an overview of the importance of 9th grade see Allensworth, E. M., & Easton, J. Q. (2007). What Matters for Staying On-Track and Graduating in Chicago Public High Schools: A Close Look at Course Grades, Failures, and Attendance in the Freshman Year. Consortium on Chicago School Research. For work on high school transition see, e.g., Pharris-Ciurej, N., Hirschman, C., & Willhoft, J. (2012). The 9th grade shock and the high school dropout crisis. Social Science Research, 41(3), 709-730.
[4] We pooled the responses from the 2014-2015 and 2015-16 school years to enlarge the sample size for this analysis. The sample includes responses from all 9th graders, including those who are repeating the grade. It is important to note that the responses of 9th graders may not be representative of all students in the school.
[5] In 2015, this question was asked with a slightly different wording: “I feel that my teachers appreciate my culture/background."
[6] For Bullying, responses correspond to the categories “None of the Time,” “Some of the Time,” “Most of the Time,” and “All of the Time.” For all other questions, they correspond to the categories “Strong Disagree,” “Disagree,” “Agree,” and “Strongly Agree.”
[7] These five measures have a high degree of consistency, with Cronbach’s alpha coefficients of .79 in 2015 and .80 in 2016, supporting the methodological decision to use the Composite School Climate measure.
How to Cite this Spotlight
Gwozdzik, S., Black, K. 2022. "How Equitable is Access to a Positive School Climate in NYC Schools?" Spotlight on NYC Schools. Research Alliance for New York City Schools.

