

During the 2016-17 school year, there were over a million students who were enrolled in a New York City public school. As is frequently pointed out, NYC has the largest school district in the country. But what does this mean in relative terms?
NYC public school students comprise almost half of all public school students in the state of New York and, as Chancellor Carranza recently noted, the population of students in the Bronx alone would be the 13th largest school district in the country. Another helpful way to understand the magnitude of NYC’s school system is to compare its size to the nation’s next three largest urban school districts. Below we present the K-12 district populations of NYC, Los Angeles, Chicago, and Houston:
As the figure shows, the student population in NYC is larger than the combined student populations of LA and Chicago (see Figure Notes below). When we add the total school population of Houston, the three cities exceed NYC’s school enrollment—but only by little over 70,000 students (about the same size as each new cohort of kindergarten students in NYC).
We can also take stock of the magnitude of the NYC school system by comparing sub-populations of students across cities. The interactive graph below allows us to explore the relative size and percentage of various groups of students in NYC, LA, Chicago, and Houston. While there are real differences across the cities, it is important to consider how each city defines and measures students. Even the seemingly simple measure of how many students are enrolled in a district is complicated by whether the district includes pre-K students and when/how students are counted.[1] Likewise, there are differences in how states and districts categorize and calculate specific student sub-groups.
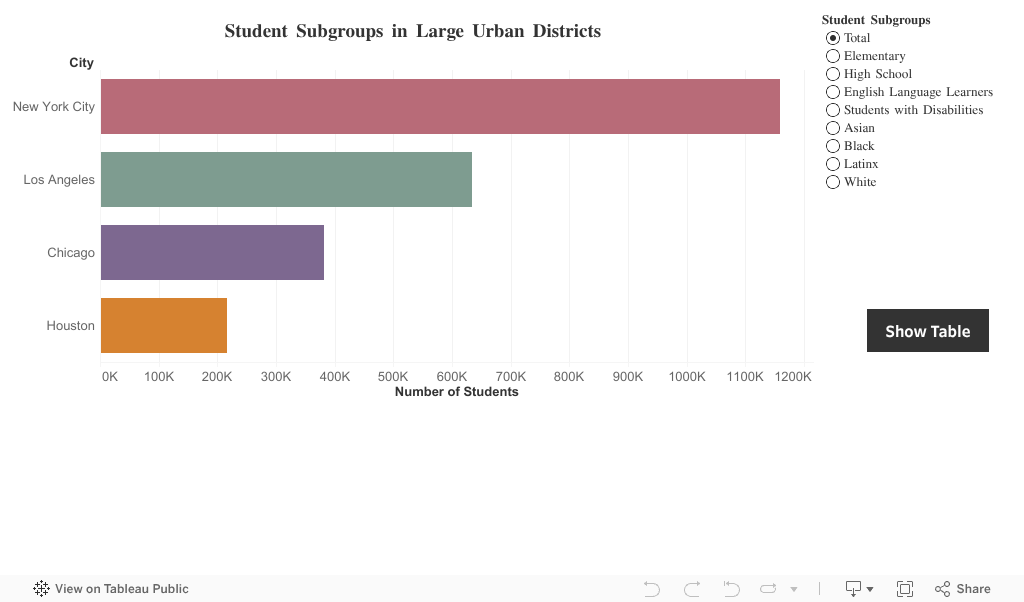
Although it is striking that each one of these cities has a large and diverse student population in terms of race/ethnicity, the sheer scale of the NYC public school system means that:
- Although Chicago has proportionally more Black students than NYC (38% compared to 26%, respectively), the number of Black students in NYC is larger than the combined Black student populations in LA, Chicago, and Houston;
- While LA and NYC have very similar numbers of Latino students (468,734 in LA and 464,102 in NYC), these students constitute almost three fourths of the public school population of LA but only about 40 percent of NYC’s total population; and
- NYC has proportionally more White and Asian students than LA, Chicago, and Houston, and a larger number of White and Asian students than all three cities pooled together.
The scale of the NYC student population has implications for policy and research. Initiatives to reach specific groups of students in NYC—like high school students, English Language Learners (ELLs) or students with disabilities—have to reach extraordinarily large numbers. For instance:
- NYC’s high school population of 320,393 is almost double that of the closest district (LA). There are more high school students in NYC than Houston’s total public school population.
- There are more ELL students in NYC (161,896) than in Chicago and Houston combined. The size of NYC’s ELL students alone is greater than the size of 90 percent of school districts in the country;[2] and
- NYC has almost 100,000 more students with disabilities than LA, Chicago, and Houston combined (20% of NYC’s students are characterized as having some type of disability, compared with 12% in LA, 14% in Chicago, and 7% in Houston, suggesting differences in how these students are classified in each of the three cities—for more information, see this report on special education equity across the United States).
The large numbers of students—and their diversity—create inherent challenges for implementing education programs and policies in NYC. For instance, school and district officials have to communicate with families who speak over 182 different languages. They also have to support and monitor the rollout of new curricula or interventions by about 75,000 teachers across 1,800 schools.
Yet, the size of NYC’s public school population also presents important opportunities. When NYC gets it right, school-based policies and practices can positively impact the lives of a vast number of students as well as their families and communities. The size of NYC’s public schools also affords researchers the opportunity to study processes and practices in ways that aren’t possible in other places. Large sample sizes enable us to examine variation within student sub-groups, for instance, and to find robust comparison groups (of students and schools) when we examine the impact of various policies, programs and initiatives.
Big Questions
As we continue to think about the relevance of our research in NYC and beyond, here are some big questions we are considering:
- Where are the differences in sub-population sizes/percentages “real,” and where do they simply reflect different data collection practices, definitions, classification schemes, etc.?
- People often compare outcomes (e.g., high school graduation rates, college enrollment, etc.) across cities. How do the differences in student population shown here complicate those comparisons?
- Are there ways that NYC leaders could take better advantage of the City’s size to produce evidence about different strategies (e.g., by using more planned variation, or staggering the roll-out of big initiatives, so we can test their impact under various conditions)?
- What has NYC learned about taking initiatives (like Pre-K for All) to scale? And how can those lessons be useful to leaders in other large urban school districts?
What else should we be asking about various NYC student populations? Let us know via email.
This post was authored by Zitsi Mirakhur, John Sludden, Jasmine Soltani and Sophie McGuinness.
Footnotes
[1] The enrollment data presented in this post for New York, Chicago and Houston include pre-K students; LA’s enrollment data do not include pre-K students.
[2] See Table 1 in this report from the US Department of Education.
Notes for Figure 1:
The numbers presented in this graph reflect the total student enrollment in NYC, Los Angeles, Chicago, and Houston. Estimates for NYC are from the Research Alliance’s calculations based on data obtained from the NYCDOE for the 2016-17 school year and include PreK-12 students who were not enrolled in District 88 schools. Enrollment data for LA come from publicly available data from the Los Angeles Unified School District for the 2016-17 school year for K-12 students (and thus does not include PreK). Enrollment data for Chicago are taken from the “20th Day Membership” report for PreK-12 students in 2016-17 school year, which is available on the website of the Chicago Public Schools. Finally, our enrollment data for Houston comes from the 2016-17 “Facts and Figures” summary the Houston Independent School District has available on their website and includes PreK-12 students.
Notes for Figure 2:
The numbers presented in this graph reflect specific subpopulations in NYC, LA, Chicago, and Houston. Estimates for NYC are from the Research Alliance’s calculations based on data obtained from the NYCDOE for the 2016-17 school year. As we allude to in the text, states have different criteria for classifying students as English Language Learners. For students with disabilities, the U.S. Department of Education provides the framework for identifying special education students, listing the conditions under which students qualify, but states have some flexibility to create their own classifications. As a result, districts in different states may be operating under slightly different criteria for identifying and counting these subgroups of students. For more information about this issue, see this report, which explores special education equity across the United States.
How to Cite this Spotlight
Mirakhur, Z., Sludden, J., Solanti, J., McGuinness, S. 2018. "NYC Public Schools: What Does it Mean to be the Nation's Largest District?" Spotlight on NYC Schools. Research Alliance for New York City Schools.