Public school students in New York City have a wide range of educational options available to them. This includes traditional neighborhood zoned schools, magnet and Gifted & Talented programs, dual language schools, charter schools, exam-based specialized high schools, and more than 750 programs (in 435 different schools) that are part of the citywide high school choice process.
Given this plethora of options across the City’s five boroughs, it is possible that many students are experiencing long commutes to school. This Spotlight post uses geographic student and school location data to estimate commuting times on foot or by public transportation for NYC’s elementary, middle, and high school students.[1] While not all students travel to school in this way, a large majority do.
Our findings indicate that:
- Travel times increase with student age. If students commute to school by foot and/or public transportation, we estimate that:
- The average kindergarten student lives 10 minutes from their school;
- The average 6th grader lives 17 minutes from their school.
- The average 9th grader lives 31 minutes from their school.
- At all levels, Black students travel significantly further to school than students from other racial/ ethnic backgrounds. For example, the average Black 6th grader lives 20 minutes from school, more than the average White (18 min), Asian (17), or Latino (15) 6th grade student. In 9th grade, the average black student lives 34 minutes from school, more than the average Asian (32), Latino (30), or White (29) 9th grader. Each of these commute times are in one direction only.
- In kindergarten and 6th grade, students attending charter schools travel much further to school than students attending traditional public schools, but the pattern reverses in high school, with charter school students attending closer to home.
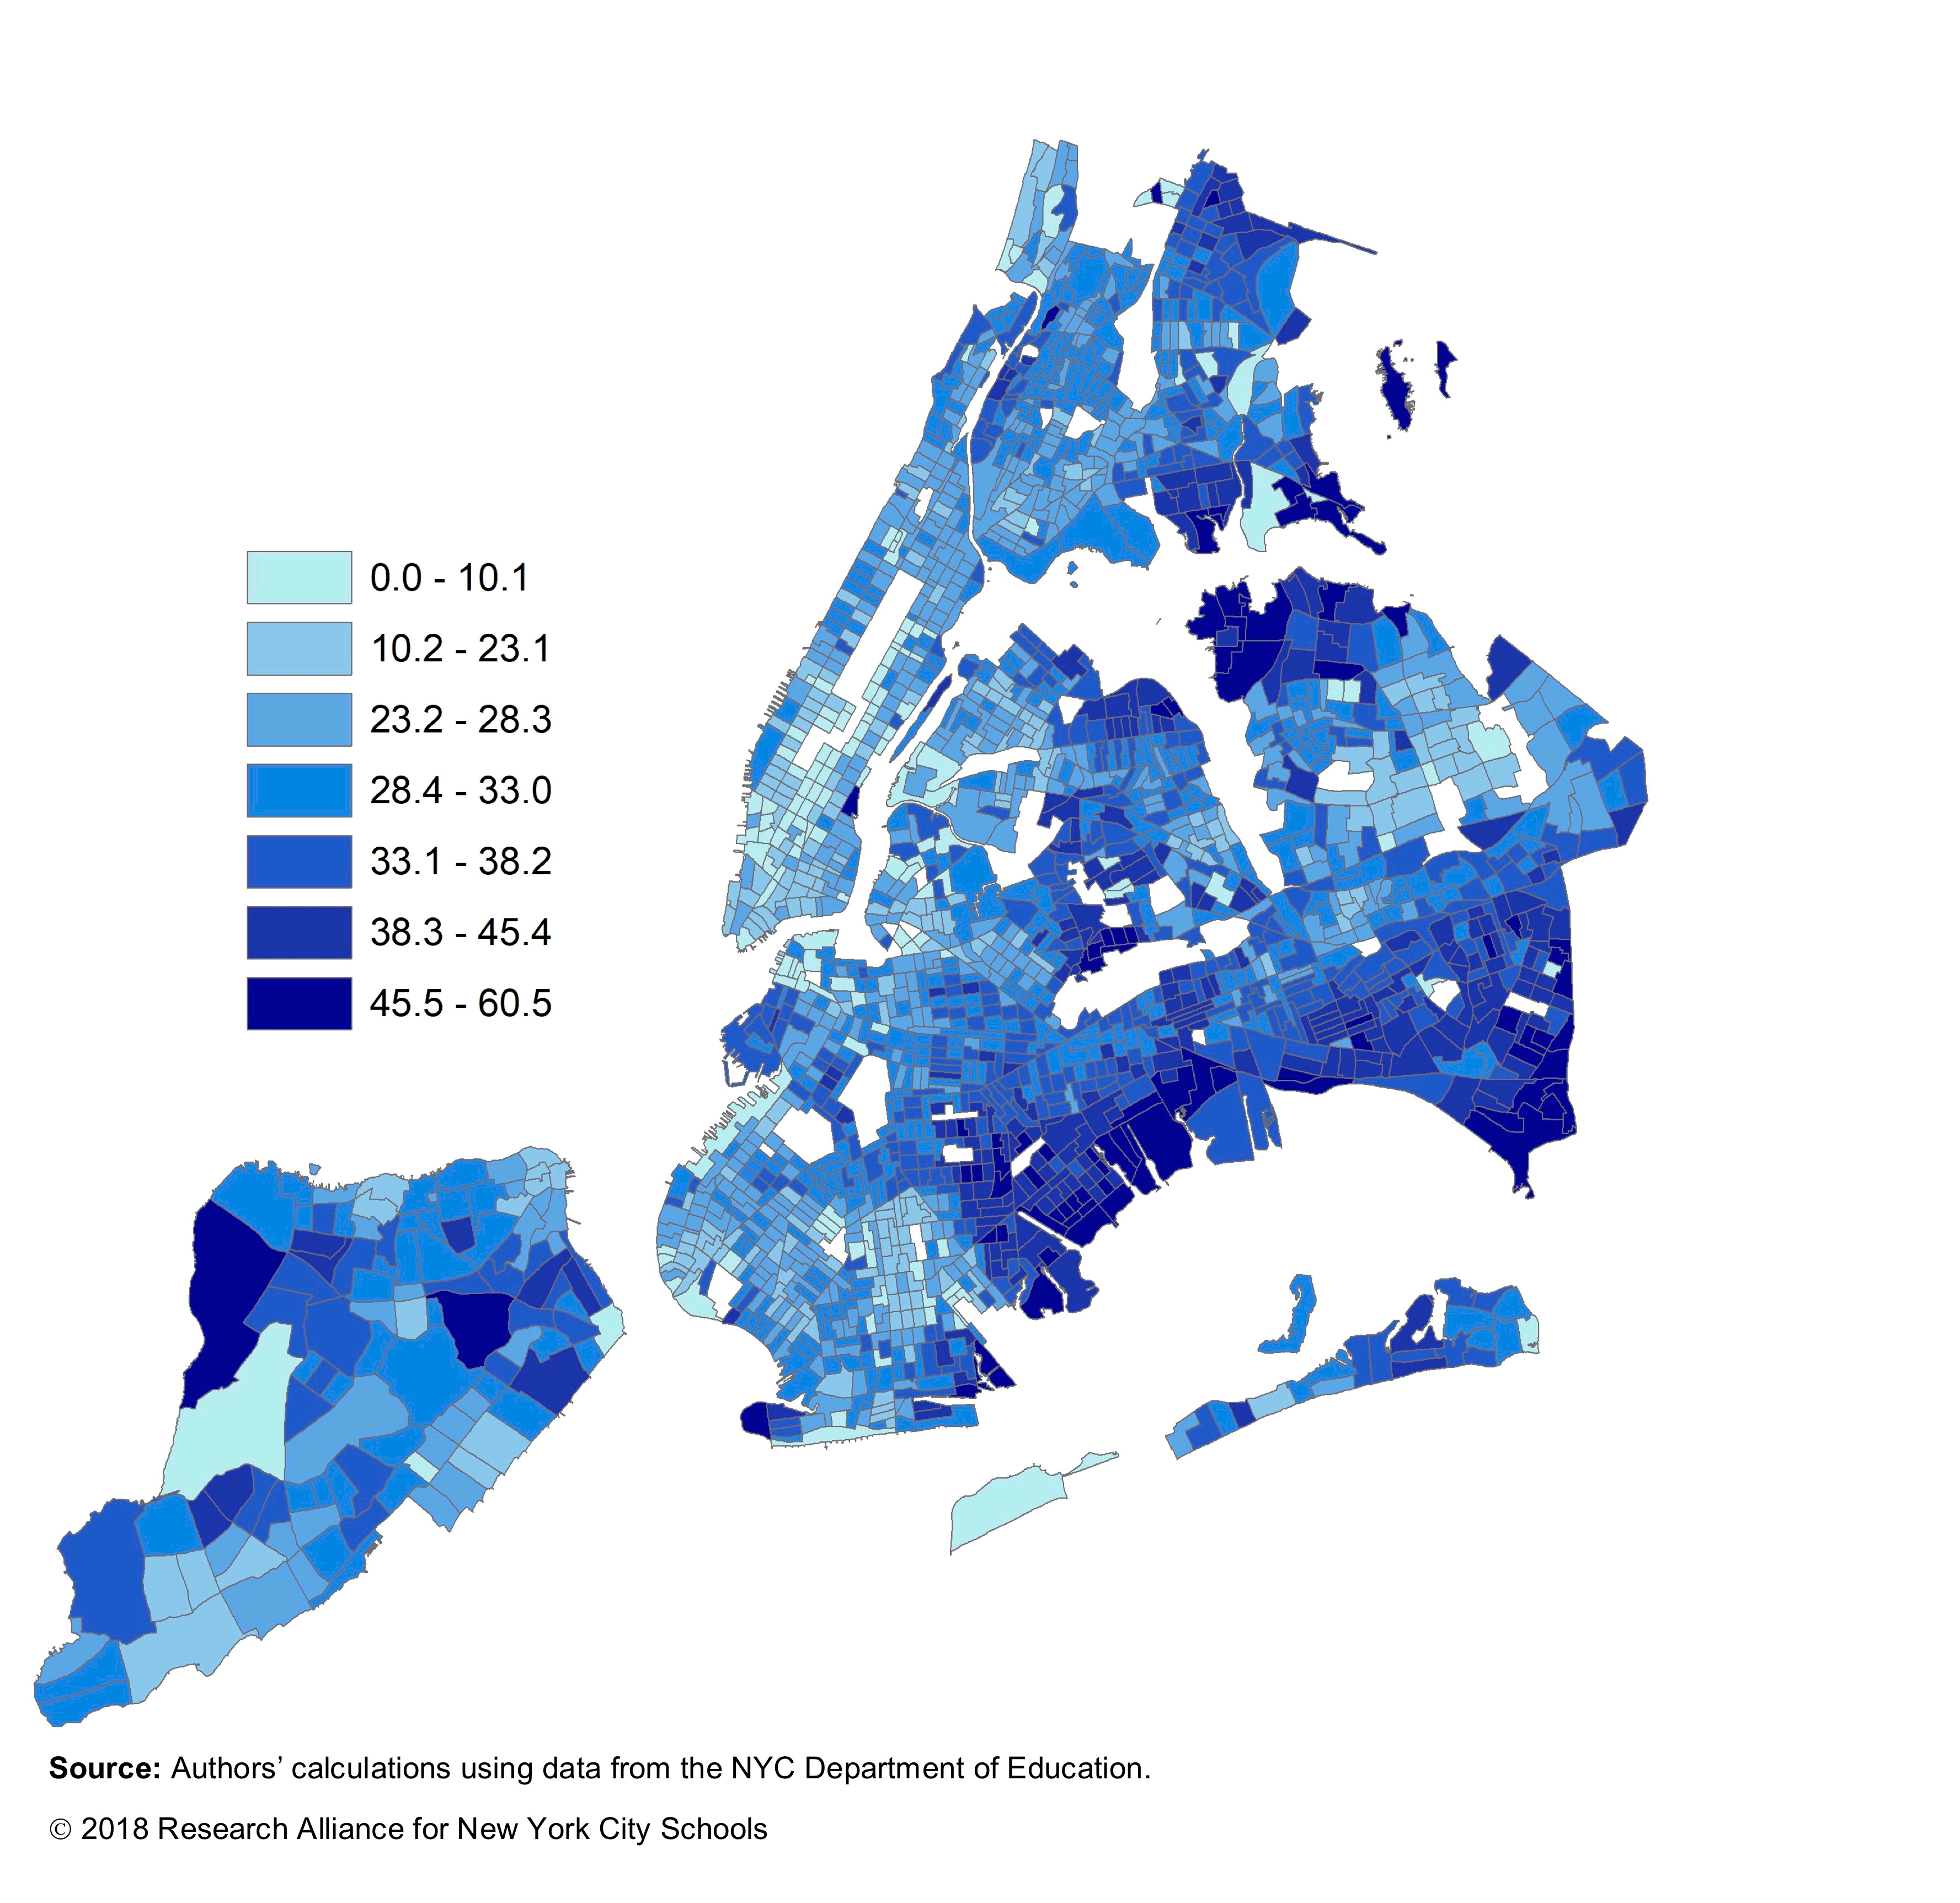
Group differences in commuting times are driven in part by residential segregation. The map below illustrates geographic differences in mean travel time for 9th graders by NYC census tract.
Map: Average Minutes of Travel Time to School by Public Transportation (One Way) for 9th Grade Students, by Census Tract, 2013-2014 School Year

As reflected in the map, certain neighborhoods of the City have systematically longer commute times to school by public transportation. These include remote neighborhoods in the Bronx (e.g., Eastchester and Co-op City, Soundview and Castle Hill), Queens (College Point, Whitestone, Ozone Park), Brooklyn (Canarsie, Marine Park, East New York), and Staten Island (Bloomfield). These areas have less access to public transportation—especially subways—and families there may rely more on transportation by car or school bus, where available. Not all NYC schools offer school bus transportation, but the ones that do tend to be in neighborhoods less well served by public transport.
Other factors, besides residential segregation, also appear to influence commute time. For instance, even after controlling for students’ residential location and charter attendance, we found that Black students experience longer commutes (although the differences between groups are smaller). Likewise, the patterns seen for students in charter schools hold even after controlling for the location of a student’s home. In 6th and 9th grade, higher-achieving students travel further to school than students who perform worse on standardized tests of math and reading.
It is hard to know whether longer commutes are good or bad for students. On the one hand, families may be willing to send their child on a longer bus or subway ride to a school that helps them succeed. On the other hand, long commutes may take time away from schoolwork or decrease student engagement with school.
It is worth noting that the travel times presented here are in one direction and thus apply both to and from school. Furthermore, these minutes accrue every school day and accumulate over time. An additional 2 to 5 minutes one way translates to 12 to 15 hours of additional commuting time over the course of a school year. For students at the far end of the distribution—like the 10 percent of 9th graders who travel nearly an hour or more each way—the commute to school is long indeed.
Big Questions:
- What factors explain Black students’ longer average commuting times?
- How does the availability of high-quality school options vary based on neighborhood and students’ race/ethnicity? (We begin to address this question in our School Choice and Commuting paper, published by the Urban Institute.)
- To what extent are longer travel times driven by students’ choices, and to what extent are they driven by differences in the schools to which students are being matched by the NYC DOE? (Again, see School Choice and Commuting.)
- What are the costs and benefits of longer commutes for students, families and communities?
This post was authored by Sean Corcoran, Associate Professor of Public Policy and Education at Vanderbilt University and Senior Technical Advisor to the Research Alliance for NYC Schools.
Footnotes
[1] This post highlights select findings from one in a series of studies on school choice and transportation published by the Urban Institute. The analysis focuses on kindergarten, 6th grade and 9th grade students. Travel estimates assume that students walk or take public transportation to school, an assumption that we believe holds for most NYC students. All results are for the 2013-14 academic year, the most recent year for which geocoded data was available at the time of the analysis.
How to Cite this Spotlight
Corcoran, S. 2018. "How Far Do NYC Students Travel to Get to School?" Spotlight on NYC Schools. Research Alliance for New York City Schools.

