Nationwide, racial and socioeconomic disparities in school discipline practices and outcomes are well established. [1] For decades, Black youth have had substantially higher rates of suspension and other forms of exclusionary discipline, compared to students of other races. [2] Black students lose the most instructional time due to suspensions, and this lost time is linked to a host of other negative outcomes, including reduced academic engagement and achievement. [3] In New York City, between 2012 and 2019, in spite of an overall decrease in suspension rates, Black students remained about 50 percent more likely to be suspended than their White and Latinx peers. [4]
While extensive research has highlighted disparities in student discipline, there has been much less focus on the ways in which individual schools may be disrupting racial inequality in suspensions. In this Spotlight post, we begin to explore NYC schools that have “beaten the odds” when it comes to student discipline. Leveraging data from the Research Alliance archive, we have been able to identify a set of inclusive discipline schools that had both:
- A low prevalence of exclusionary discipline (i.e., they are in the bottom 25% of all schools for overall suspension rate, Black student suspension rate, overall rate of office referrals [5] by teachers, Black student rate of office referrals by teachers, and overall student chronic suspension rate [6]); and
- Small or no racial disparities in exclusionary discipline (i.e., in the bottom 25% of all schools in terms of the difference between Black and White students’ suspension and office referral rates).
We found 106 middle and high schools that fit all seven of these criteria for at least one year during the study period (2011-2012 through 2018-2019). This is a little over 9 percent of all middle and high schools in our citywide sample. Notably, only 10 inclusive disciplinary schools remained so for the entire study period; on average, inclusive disciplinary schools maintained their status for two years. This suggests that our definition sets a relatively high bar for what counts as “inclusive discipline.”
Given that Black students receive a disproportionate share of suspensions and carry the heaviest burden of exclusion from class, we were particularly interested in predominantly Black inclusive discipline schools. We identified seven majority Black schools across the City that met all of the criteria for an inclusive discipline school for at least one year. [7] To understand more about the characteristics of these schools, we developed a contrasting group of predominantly Black “high discipline schools” that lies on the other end of the spectrum in terms of disciplinary outcomes (i.e., a very high prevalence of exclusionary discipline and large disparities in discipline by race). [8] We then compared the inclusive discipline schools and the high discipline schools with a third group of predominantly Black “median discipline schools.” This third group includes the vast majority of schools in our sample (82 percent of predominantly Black schools and 76 percent of schools overall).
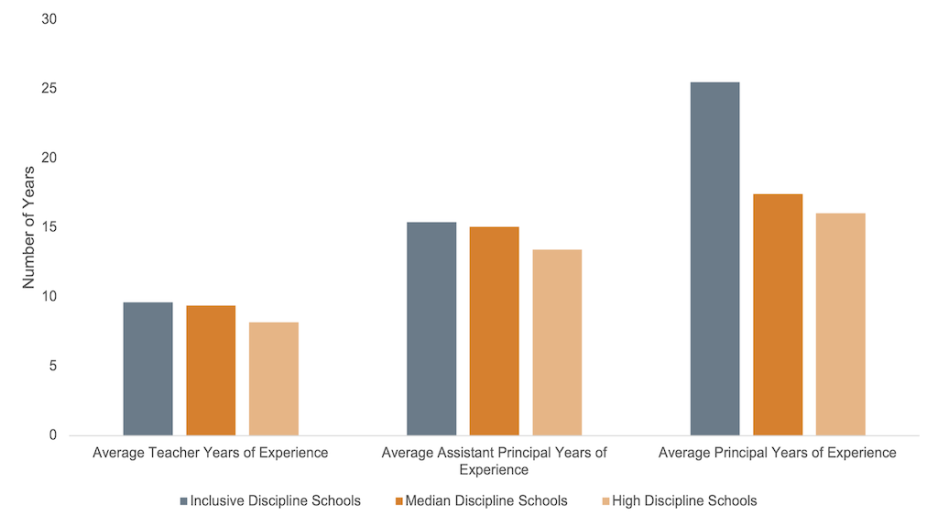
Building on prior studies that point to staff diversity and experience as integral elements of a positive school climate, including disciplinary outcomes, we examined staff characteristics across the three groups of schools. As shown in Figure 1, on average, teachers at inclusive discipline schools had roughly ten years of teaching experience, while those at high discipline schools had eight. This is in line with other research showing that teachers with less experience are more likely to make office referrals, particularly for Black and Latinx students. [9] Assistant principals in both the inclusive discipline schools and the median discipline schools had slightly more experience than those in high discipline schools. Perhaps most striking, principals at inclusive disciplinary schools had many more years under their belt than those at high and median discipline schools (an average of 26 years, versus 16 and 17 respectively). In analyses not shown here, we found that the percentage of teachers or administrators with advanced degrees was similar across the three groups of schools.
Figure 1: Staff Experience Levels in Predominantly Black Inclusive Discipline Schools, Median Discipline Schools, and High Discipline Schools

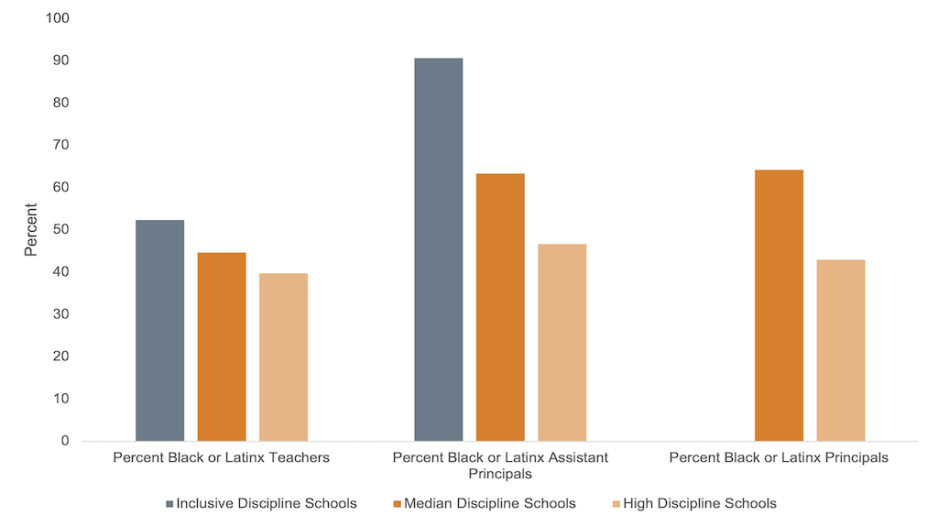
We also examined the racial composition of staff across the three groups of schools. Figure 2 shows that, in inclusive discipline schools, 91 percent of assistant principals were Black or Latinx, in contrast to 47 percent at high discipline schools and 63 percent for median discipline schools. The teaching staff at inclusive discipline schools were also somewhat more diverse than at high and median discipline schools. We found that 52 percent of educators at inclusive discipline schools were Black or Latinx, compared with 40 percent at high discipline schools and 45 percent in median discipline schools. There were no Black or Latinx principals in the inclusive discipline schools, compared with 43 percent and 64 percent in high and median disciplinary schools, respectively. [10] This may be related to our experience finding, as Black principals in NYC have fewer years of experience on average. It may also be the case that Black principals tend to be assigned to school environments associated with a higher prevalence of exclusionary discipline.
Figure 2: Staff Racial Diversity in Predominantly Black Inclusive Discipline Schools, Median Discipline Schools, and High Discipline Schools

These analyses are part of a larger, ongoing body of research on student discipline and its connection to student achievement and success. While the work presented in this Spotlight largely relies on quantitative data, we have qualitative research underway that is allowing us to dig deeper into the characteristics and practices of inclusive discipline schools. Preliminary findings indicate that the inclusive discipline schools tend to be very intentional about setting behavioral standards, expectations and norms at the start of the school year, and that many of them distinguish between behavioral expectations, on the one hand, and academic expectations, on the other. One school, for example, crafted a behavioral rubric for students, providing a tangible understanding of staff expectations and guidelines and a tool that students could use to assess their own behavior throughout the school year. Our qualitative research also underscores the importance of relationships in schools and how these may affect disciplinary outcomes. We look forward to sharing more of these findings in coming months, as we work to highlight the ways in which schools can successfully dismantle exclusionary practices that are detrimental to Black youth.
Big Questions
- How do neighborhood characteristics (such as poverty, employment, crime and demographics) differ between inclusive discipline schools and non-inclusive discipline schools? How does community context shape in-school relationships and school discipline practices?
- What professional development or support might help less experienced teachers improve their classroom management and reduce their use of exclusionary discipline?
- How do students perceive the school climate at the three types of schools identified in our study? What are inclusive discipline schools doing (i.e., specific structures and practices) that differs from what is happening in median and high discipline schools?
- Do more inclusive disciplinary practices support higher academic achievement?
This post was authored by Richard Welsh, Luis Rodriguez, and Blaise Joseph, with Kayla Stewart. For more detailed findings, please see Beating the School Discipline Odds: Conceptualizing and Examining Inclusive Disciplinary Schools in New York City.
Endnotes
[1] For example, see Petras H, Masyn KE, Buckley JA, Ialongo NS, Kellam S. 2011. “Who is most at risk for school removal? A multilevel discrete-time survival analysis of individual-and context-level influences.” Journal of Educational Psychology. See also Skiba RJ, Michael RS, Nardo AC, Peterson RL. 2002. “The color of discipline: Sources of racial and gender disproportionality in school punishment.” The Urban Review. 2002;34(4):317–342.
[2] Nationally, in 2015-16, Black students were three times more likely to receive an out-of-school suspension relative to their White peers (Shores et al., 2020) and in 2017-18, Black students accounted for 38 percent of an out-of-school suspensions but only 15 percent of public school students (Civil Rights Data Collection, 2021).
[3] See Bacher-Hicks, A., Billings, S. B., & Deming, D. J. (2019). The School to Prison Pipeline: LongRun Impacts of School Suspensions on Adult Crime (No. w26257). National Bureau of Economic Research.
Chu E. M., Ready D. D. (2018). Exclusion and urban public high schools: Short- and long-term consequences of school suspensions. American Journal of Education, 124(4), 479–509.
Hwang N. (2018). Suspensions and achievement: Varying links by type, frequency, and subgroup. Educational Researcher, 47(6), 363–374. https://doi.org/10.3102/0013189X18779579
Losen, D. J., & Whitaker, A. (2017). Lost instruction: The disparate impact of the school discipline gap in California. Civil Rights Project-Proyecto Derechos Civiles.
Sorensen L. C., Bushway S. D., Gifford E. J. (2022). Getting tough? The effects of discretionary principal discipline on student outcomes. Annenberg Institute for School Reform at Brown University, EdWorkingPapers.
Welsh, R.O. (2021). Why, Really, Are So Many Black Kids Suspended. Education Week.
See also: School Suspensions Do More Harm than Good.
[4] Rodriguez, L. A., & Welsh, R. O. (2022). “The Dimensions of School Discipline: Toward a Comprehensive Framework for Measuring Discipline Patterns and Outcomes in Schools.” AERA Open, 8(1), 1-23.
[5] Office referrals are when teachers remove students from the classroom, with the possibility of further action by school leaders.
[6] Chronic suspension rate is the percentage of students who receive more than one suspension in a given school year.
[7] It is worth noting that predominantly Black schools were less likely than others to be classified as “inclusive discipline schools.” Only 3 percent of predominantly Black schools were inclusive discipline schools, compared with 9 percent of all schools in our sample.
[8] We defined “high discipline schools” using the seven criteria described above to identify schools that have both a high prevalence of exclusionary discipline (i.e., overall and Black student suspension and office referral rates and the overall chronic suspension rate are in the top quartile of all schools) and extreme disparities in exclusionary discipline by race (i.e., difference between Black–White suspension and office referral rates are in the top quartile of all schools). “Median disciplinary schools” are defined as all schools that are neither inclusive nor high discipline schools.
[9] For more information, see "Study Finds That a Small Number of Teachers Effectively Double the Racial Gaps Among Students Referred for Disciplinary Action." As one of the authors of the study, Jing Liu, explains, “We were really surprised to find this small group of teachers engaged in extensive referring and how big an impact they had on expanding racial disparities…. The positive takeaway was that the group of top referrers in our study represented a relatively manageable number of educators, who could be targeted with interventions and other supports.' "
[10] It should be noted that for some of the schools/years in our study, there was no active principal listed in our data. This was the case for two of the seven IDS schools. With such small numbers of schools, the addition of even one Black or Latinx principal would shift the percentages considerably.
Figure Notes
Source: Author calculations based on data obtained from NYC Public Schools.
Notes: Sample includes 7 IDS, 250 MDS, and 48 HDS.
Suggested Citation
Welsh, R., Rodriguez, L., Joseph, B., with Stewart, K. (2024). “What Are the Characteristics of Predominantly Black ‘Inclusive Discipline’ Schools in New York City?” Spotlight on NYC Schools. Research Alliance for New York City Schools.

