

How Do Middle School Opportunities Vary by Neighborhood Income, Race/Ethnicity, IEP Status, EL Status, and Gender?
In 2019, the National Academies of Sciences (NAS) published recommendations for monitoring educational equity. Building on these recommendations, the Research Alliance has been working to develop a comprehensive set of equity indicators for NYC schools. An earlier Spotlight post in our Equity Indicators series emphasized the importance and challenges of tracking equity and examined students’ high school outcomes by race/ethnicity and neighborhood income. An accompanying post outlined our framework for assessing equity in opportunities within the NYC system and explored differences in opportunities between high schools.
In this post we shift to looking at differences in opportunities available to middle school students by the average income in their home’ neighborhood, their race/ethnicity, whether they have an Individualized Education Plan (IEP), their English Learner (EL) status, and their gender.[1] Endnote details The opportunity measures we explore are Access to Advanced Coursework, Limited Use of Suspensions, and Supportive School Climate. This analysis includes 52,581 students who began 6th grade in the 2020-2021 school year and follows them through their scheduled 8th grade year in 2022-23. The sample encompasses 477 schools serving students in grades 6-8, including K-8 schools and excluding charters and district 75 special education schools. An accompanying post examines outcome measures at the middle school level, with a breakdown by the same demographic categories. While this analysis shows which students attend schools with more opportunities overall, it does not consider the extent to which different groups of students end up benefiting from these opportunities (e.g., by taking an advanced class, avoiding being suspended, or feeling supported at school). An upcoming post in the series will explore differences in access to opportunities within schools.
Advanced Coursework
(NAS Disparities in Access to Rigorous Coursework Indicator)
Accelerated courses in middle school are often prerequisites for opportunities in high school, such as enrollment in college level courses, which are predictive of later educational success. In NYC middle schools, students are able to take accelerated courses for high school credit — most commonly Algebra I. Enrollment in Algebra I is strongly associated with enrollment in the highest academic opportunity high schools. However, access to these courses varies. Principals determine which accelerated courses to offer and which students are eligible to take them. Research indicates that while universal math acceleration has mixed outcomes, targeted policies based on prior performance boost enrollment in college track math courses—especially among qualified students who may have been overlooked as a result of biases. The interactive graphic below shows the proportion of students who attend middle schools with low, moderate, and high levels of accelerated course offerings; this information can be viewed by students’ neighborhood income, race/ethnicity, gender, or IEP or EL status.
Advanced Coursework Dashboard
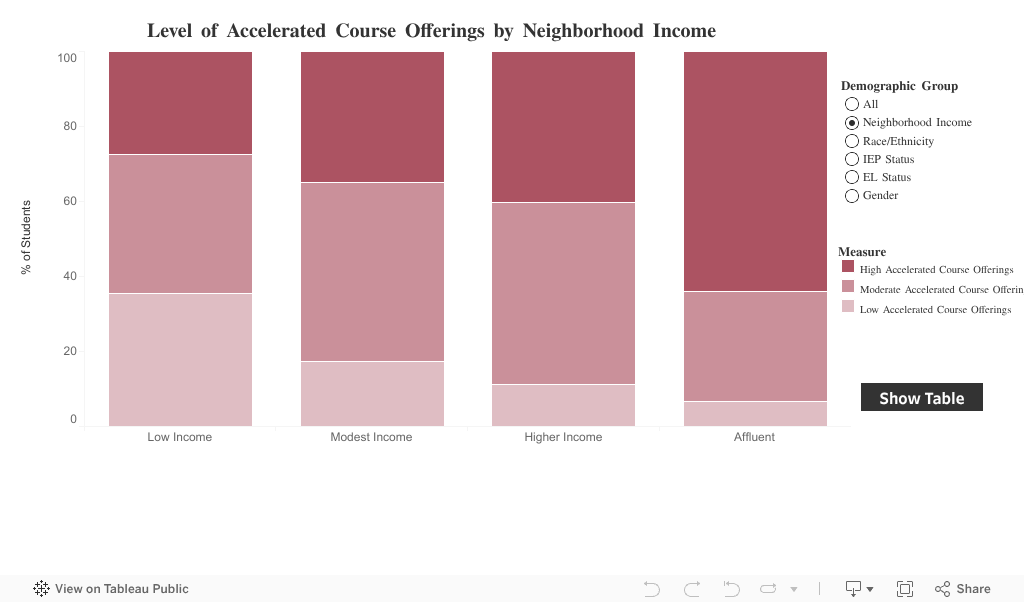
The graph shows that, as income level increased, students were more likely to attend schools offering high levels of accelerated courses and less likely to attend schools with low levels of accelerated courses. Filtering by race/ethnicity, we see that White and other race/ethnicity students were the most likely to attend high accelerated offering schools, at just under 50 percent. Black and Latinx students were about four times more likely than Asian and White students to attend schools with low levels of accelerated course offerings. We see similar rates of enrollment in high opportunity schools for students with and without IEPs, but students with IEPs were more likely to attend low opportunity schools, and less likely to attend moderate opportunity schools, than students without IEPs. Filtering by EL status, we see that Current EL students were more likely to attend low opportunity schools and less likely to attend high opportunity schools. Never ELs were overrepresented in high opportunity schools, compared to the other two groups. The majority of Former ELs (53%) attended a moderate opportunity school.
Limited Use of Suspensions
(NAS Disparities in Nonexclusionary Discipline Practices indicator)
Research has shown that suspensions and other forms of exclusionary discipline have negative effects on school performance and attendance. For younger students, evidence suggests that more severe discipline may actually increase future misbehavior. In response, many school districts, including NYCPS, have started to move away from suspensions, favoring more non-exclusionary approaches that keep students in the classroom, often incorporating restorative practices. The dashboard below allows us to examine which students attend schools with high, moderate, and low use of suspensions, based on the percentage of reported incidents that result in a suspension.
Suspension Use Dashboard
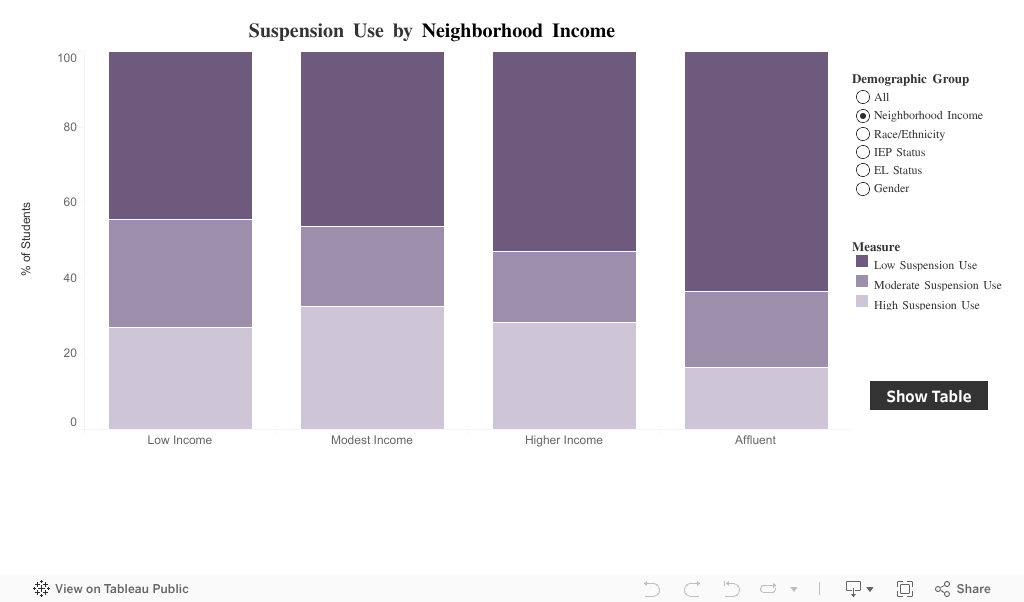
The figure shows that about half of all students attended schools with low use of suspensions. As neighborhood income increased, students were more likely to be in these low-suspension-use schools. Looking at race/ethnicity, we see that Asian students were the most likely to attend schools with high use of suspensions, at 34 percent, compared to Latinx students (29%) and White and Black students (24%). This is notably different from our analysis of high school opportunities, which found that Black students were much more likely than others to be enrolled in high-suspension-use schools. At both the middle and high school level, individual Black students were substantially more likely to be suspended than other students, as described in our outcomes post. We will examine this issue more closely on our forthcoming analysis of within-school inequities.
Middle school students with IEPs were less likely to attend high suspension-use schools and equally as likely to attend low-suspension-use schools as those without. Looking at EL status, we see that Former and Current ELs attend high suspension use schools more often than Never ELs, who attend low-suspension-use schools at the highest rates.
Supportive School Climate
(NAS “Disparities in School Climate” Indicator)
Evidence shows that a positive school climate is important for students’ academic success and socioemotional wellbeing. Below we examine the rate at which students attend low, moderate, and high opportunity middle schools in terms of school climate. This measure reflects each school’s average student response to a number of survey items related to relationships, belonging, support, and safety over grades 6-8. (See list of survey items below.
School Support Survey Items
- I am safe in my classes.
- I am safe in the hallways, bathrooms, and locker rooms at my school.
- There is gang activity in my school.
- Students use alcohol or illegal drugs while at school.
- My teachers give me specific suggestions about how I can improve my work in class.
- My teachers notice if I have trouble learning something.
- My teachers explain things a different way if I don't understand something in class.
- My teachers help me catch up if I am behind.
- I learn a lot from feedback on my work.
- The work we do in class is good preparation for our class tests.
- In how many of your classes do your teachers want students to become better thinkers, not just memorize things?
- My teachers treat me with respect.
- My classes at this school really make me think critically.
- At this school students harass, bully, or intimidate other students.
- At this school students harass, bully, or intimidate each other because of their race or ethnicity.
- At this school students harass, bully, or intimidate each other because of their gender, gender identity, gender expression, or sexual orientation.
- I feel that my teachers respect my culture/background.
- I see people of many races, ethnicities, cultures, and backgrounds represented in the curriculum.
- My teachers use examples of students from different cultures/backgrounds/families in their lessons to make learning more meaningful for me.
- I feel safe outside and around this school.
- I feel safe traveling between home and this school.
Supportive School Climate Dashboard

Our analyses show relatively small differences in school climate opportunity based on students’ home neighborhood income, however sizeable disparities are revealed when looking at race/ethnicity. Black students are almost twice as likely as Asian, Latinx, and White students to attend schools with low levels of perceived support. They are also the least likely to attend high-support schools, at 17 percent; White students are the most likely to attend these schools, at 26 percent. We do not see differences in school climate opportunity by IEP status. Never EL students are slightly more likely to attend low-support schools, with 28 percent enrolled in such schools, compared to 22 percent of Former ELs and 25 percent of Current ELs. Former ELs are the most likely to attend high-support schools, at 24 percent.
While these analyses focus on differences in access to high-opportunity schools, the level of equity within a school environment is also important to consider. In our next post, we will compare the experiences of different groups of students within schools with the same level of opportunity.
Big Questions
- What would it take to offer more advanced classes in the low academic opportunity schools? What kinds of support would students need to ensure they can succeed in these classes, given varying levels of prior academic preparation? Within high opportunity schools, are some groups of students still underrepresented in advanced classes?
- Disparities by race/ethnicity and neighborhood income in enrollment at schools with low accelerated course offerings are about twice as large in middle school as in high school. Why are differences in access to advanced coursework greater at the middle school level than in high school?
- Are there practices in place in high opportunity / low use of suspension schools that could be replicated elsewhere across the district? Within these schools, are certain students still more likely to be suspended? Which schools have made the most progress toward equitable, non-exclusionary discipline?
- What approaches are in place to foster a positive learning environment in schools with the highest school climate scores? Are there meaningful differences in how students within the same school perceive the learning environment? If so, what accounts for these differences?
- How do equity indicators vary across middle schools with different grade configurations (e.g., K-8 vs. 6-8 vs. 6-12)?
- What other dimensions of schooling are important to take into account to understand educational equity? For example, what patterns might emerge if we examined differences in students’ access to high-quality school facilities, including comfortable temperatures, adequate lighting, well functioning technology and clean bathrooms, classrooms, and hallways? What about the quality of school libraries and cafeterias, and the availability of green space?
This Spotlight post was authored by Erin Readling, James Kemple and Chelsea Farley.
Suggested Citation
Readling, E., Kemple, J., and Farley, C. (2025) “Equity Indicators: How do NYC Middle School Opportunities Vary by Neighborhood Income, Race/Ethnicity, IEP Status, EL Status, and Gender?” Spotlight on NYC Schools. Research Alliance for New York City Schools.
Endnotes
- Our categories for gender (“male” and “female”) are based on gender marker data collected by NYC Public Schools. Students are able to change their gender marker in their permanent record with parental approval. Gender marker X – Neither Female nor Male (e.g. identifies as non-binary, gender expansive, or gender fluid) became an option in 2022-23, but because this set of analyses follow a cohort of students who enrolled in NYC middle schools in their 6th grade year (2019), we do not have an X subgroup. Neighborhood income categories are as follows: Affluent = median household income in the top 20th percentile of all NYC Census tracts (>$110,250); Higher Income = median household income between the 50th and 80th percentile ($74,696-$110,250); Modest Income = median household income between the 20th and 50th percentile ($47,500-$74,695); and Low Income = median household income in the bottom 20th percentile(< $47,500). EL Status is based upon whether a student was receiving English language services upon entry in their 6th grade year. The EL Status categories are as follows: Never EL: has never received EL services, Current EL: was receiving EL services at the start of 6th grade, Former EL: was not receiving EL services at the start of 6th grade but was at some point in the past. IEP Status is based upon whether a student had an IEP upon entry in their 6th grade year. The sample of students with IEPs includes those identified for special education services that are included in or are offered in addition to education provided in general classroom settings. The sample does not include students enrolled in District 75 schools or who receive services primarily or exclusively in settings comprised of students with disabilities. Learn more about IEP status in NYC. ↩
Figure Notes
Advanced Coursework Dashboard
Source: Research Alliance calculations based on data obtained from NYC Public Schools
Notes: The accelerated coursework measure was created by dividing the number of students enrolled in any course coded as “accelerated” in Grades 6-8 by 25 to create a proxy for available accelerated course sections. To control for the size of the school, the number of course sections was divided by the number of students in Grade 8 (the year when students typically take accelerated courses, most commonly Algebra I). High = Average 3.5 or more accelerated course sections for every 25 students in Grade 8. Low = Fewer than 1.0 accelerated course section offered for every 25 students in Grade 8. Moderate = Between 1.0 and 3.5 accelerated course sections offered for every 25 students in Grade 8.
Suspension Use Dashboard
Source: Research Alliance calculations based on data obtained from NYC Public Schools
Notes: Suspension Rate was measured by the percentage of major and minor disciplinary incidents that resulted in a suspension over grades 6-8. High opportunity (low use of suspensions) = Fewer than 6 percent of minor incidents AND fewer than 46 percent of major incidents resulted in a suspension. Low opportunity (high use of suspensions) = More than 6 percent of minor incidents AND more than 46 percent of major incidents resulted in a suspension. Moderate opportunity (moderate use of suspensions) = Either 6 percent or more of minor incidents resulted in a suspension or 46 percent or more of major incidents resulted in a suspension.
Supportive School Climate Dashboard
Source: Research Alliance calculations based on data obtained from NYC Public Schools
Notes: Supportive School Climate was measured by averaging student survey measures of support, belonging, safe environment, and safe behaviors over grades 6-8. Students rated each survey item on a scale from 1 to 4, with 4 being the most positive. High Opportunity/Support = Average response of 3.2 or higher; Low Opportunity/Support = Average response of 3.0 or lower. Moderate Opportunity/Support = Average response between 3.0 and 3.2.