

How Do Middle School Outcomes Vary by Neighborhood Income, Race/Ethnicity, IEP Status, EL Status, and Gender?
In 2019, the National Academies of Sciences (NAS) published recommendations for monitoring educational equity. Building on these recommendations, the Research Alliance has been working to develop a comprehensive set of equity indicators for NYC schools. An earlier spotlight post in our Equity Indicators series emphasized the importance and challenges of tracking equity and examined students’ high school outcomes by race/ethnicity and neighborhood income. An accompanying post outlined our framework for assessing equity in opportunities within the NYC system and explored differences in opportunities between high schools.
In this post we shift to looking at outcome measures at the middle school level. Research has shown that grades and attendance in middle school are highly predictive of high school success and college readiness. Addressing inequity at the middle school level is important for closing gaps in high school and post-secondary outcomes. In this post we examine attendance, grades, test scores, and suspension rates, focusing on differences by race/ethnicity, neighborhood income, Individualized Education Plan (IEP) status, English Learner (EL) status, and gender. [1] Endnote details This analysis includes 52,581 students who began 6th grade in the 2020-2021 school year and follows them through their scheduled 8th grade year in 2022-23. The sample encompasses 477 schools serving students in grades 6-8, including K-8 schools and excluding charters and district 75 special education schools. An accompanying post looks at access to middle school opportunities, including rigorous academic coursework, supportive school climate, and nonexclusionary discipline practices. Next in this series, we will turn to examining differences in access to opportunities within schools.
Attendance
(NAS Engagement in Schooling Indicator)
Extensive research has shown that attendance is crucial for student success. Chronic absenteeism, defined as missing more than 10 percent of the school year or more than 18 days, has been a particular concern in recent years. Across the country, schools saw severe drops in attendance during the COVID-19 pandemic, and attendance rates still have not recovered to pre-pandemic levels. The figure below allows you to view attendance and chronic absentee rates by students’ race/ethnicity, gender, the average income level in a students’ home neighborhood, or by IEP or EL status.
Attendance Dashboard
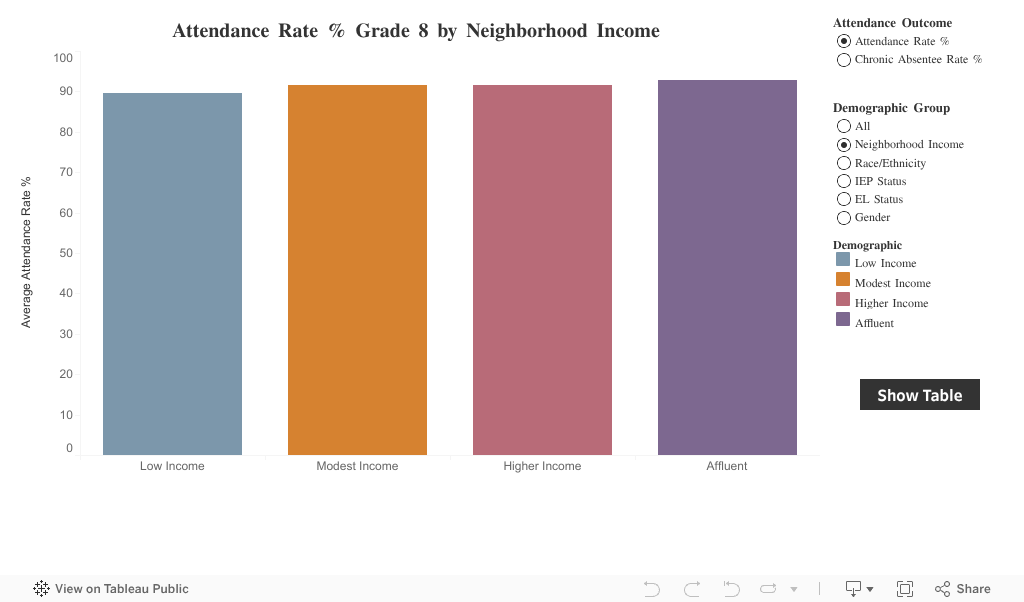
Notably, average attendance rates were higher across groups in middle school than in high school, and disparities were smaller. Most student subgroups had average attendance rates near or above 90 percent—a commonly recognized benchmark for sufficient engagement. Still, chronic absence rates show that a significant portion of students across demographics are missing too many days of school. Students from low-income neighborhoods were the most likely to be chronically absent, at 32 percent, which is about 1.3x as likely as students from modest or high-income neighborhoods and 1.8x as likely as those from affluent neighborhoods. Looking at differences by race, 31 percent of Black and Latinx students were chronically absent — about 1.4x times the rate of White students and 2.6x the rate for Asian students. Students with IEPs were 1.5x more likely to be chronically absent than those without, and Never and Current ELS were 1.7x more likely to be chronically absent than Former ELs.
Educators and policymakers should continue to focus on improving attendance among chronically absent students, keeping in mind that the reasons for missing school may vary. Research has identified several effective strategies for improving attendance, including text alerts to parents, cash incentives, culturally relevant pedagogy, non-exclusionary discipline practices, support for student health and wellness, and efforts to strengthen student-teacher relationships and overall school climate.
Suspensions
(NAS Engagement in Schooling Indicator)
The next figure shows the percentage of students in different demographic groups who were suspended one or more times during grades 6-8. Research has shown that suspensions have a detrimental effect on students’ academic performance, and are linked with school dropout (Rumberger and Losen, 2016). These links are especially troubling since students from underrepresented backgrounds are suspended at higher rates.
Suspension Dashboard
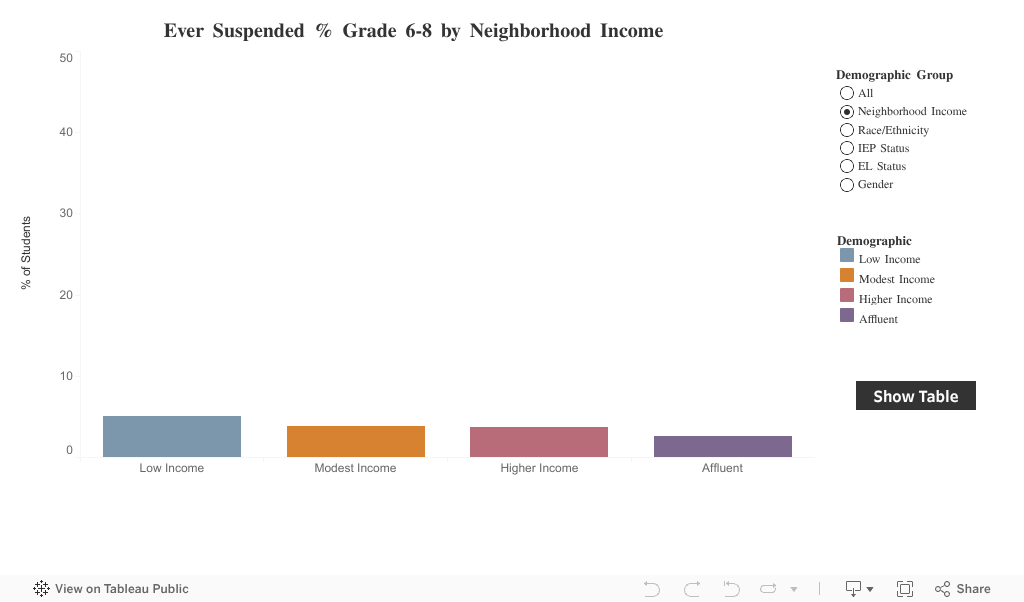
Looking by neighborhood income, we see that about 5 percent of students from low-income neighborhoods had been suspended—twice the rate of students from affluent neighborhoods. Disparities by race/ethnicity are even more pronounced. Black students are 1.75x more likely to be suspended than Latinx students, 2.3x more likely than White students, and 3.5x more likely than Asian students. We also see higher suspension rates among students with IEPs (6%), compared to those without (around 4%), and among Never ELs (4.5%), compared to Current and Former ELs (3.7% and 2.5% respectively). Suspension rates were higher for male students, at 5 percent, compared to female students, at 3 percent.
In recent years, NYC Public Schools have implemented a number of policies aimed at reducing the use of suspensions across the City, and overall suspension rates have trended downward. Yet our findings highlight continued inequity in disciplinary outcomes within NYC middle schools. Although this analysis only shows one set of student characteristics at a time, prior research has shown that disparities in suspension rates are greater when considering the intersection of race, gender, and disability status. It is important to note that some schools have beaten these odds and managed to achieve both a low prevalence of exclusionary discipline and small or no racial disparities in disciplinary outcomes. Learning from these schools holds promise as a way to improve disciplinary approaches district wide.
Grades
(NAS Performance in Coursework Indicator)
Next we turn to the average grades of students in their scheduled 8th grade year. Research has shown that Grade 8 academic performance is a strong predictor of academic success in high school (Casillas et al., 2012, Allensworth et al., 2014). This analysis examines the percentage of students who achieved a grade point average of 85 percent or higher.
GPA Dashboard
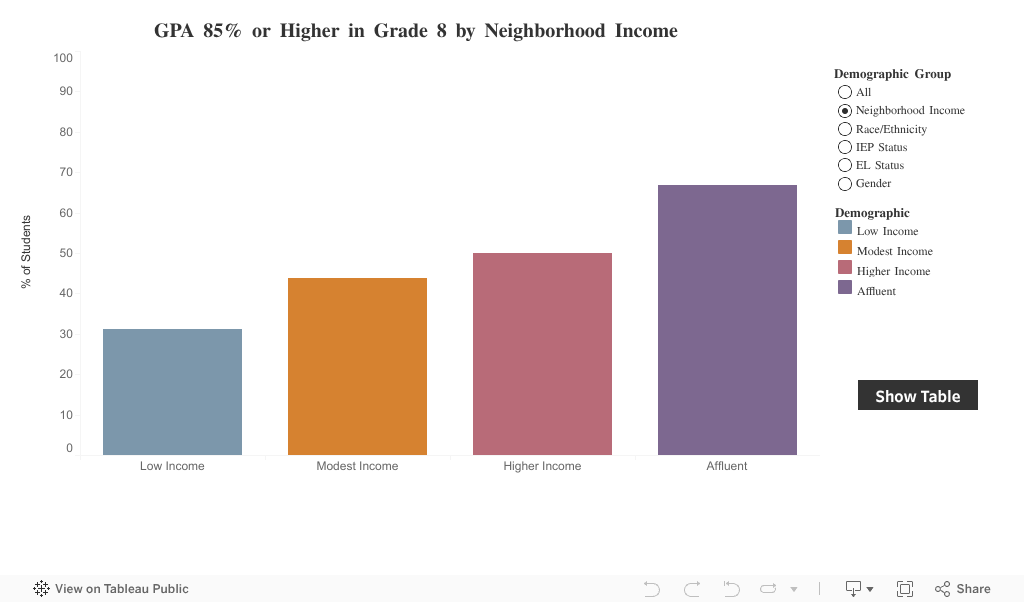
Filtering by neighborhood income, we see large disparities in GPA. The majority (67%) of students from affluent neighborhoods met our GPA benchmark, compared to just 30% of low-income students. Disparities become even greater when examining GPA by race/ethnicity; Asian students were the most likely to reach the 85 percent benchmark (at 73%)—1.1x more likely than White students, 2.2x more likely than Latinx students, and 3x more likely than Black students. While approximately half of students without IEPs met this threshold, fewer than one in four students with IEPs did. Once again, we see Former ELs with relatively strong outcomes—they were twice as likely to reach our GPA benchmark as Current ELs and 1.4x more likely than Never ELs. Half of female students have a GPA of 85% or higher, compared to just 40 percent of male students.
Test Scores
(NAS Performance on Tests Indicator)
The final figure describes students’ performance on grade 8 annual assessments in Math and English Language Arts (ELA). While there are limitations to these tests, prior research has shown that they are a reasonably good predictor of students’ future academic achievement. Our analysis examines the percentage of students who scored a 3 or 4, meaning they met or exceeded proficiency standards.
Test Scores Dashboard
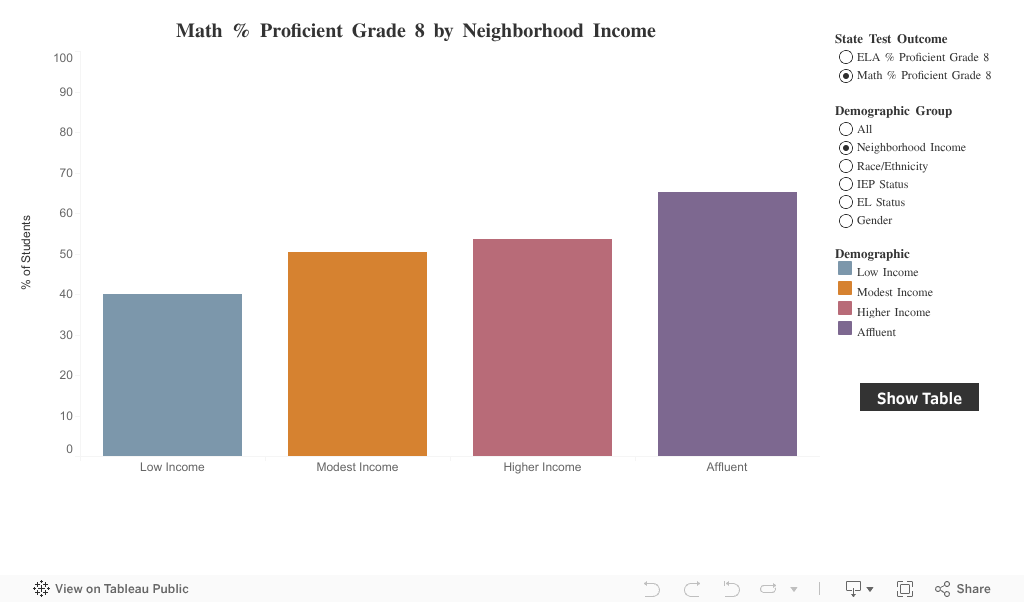
First, we turn our attention to math scores. In 2023, fewer than half of NYC 8th grade students who took the annual assessment in Math met proficiency standards.[2] Endnote details Again, we see similar patterns of disparity, with affluent students being 1.5x more likely to reach proficiency in math than low-income students, and Asian students being 1.2x more likely than White students, 2x more likely than Latinx students and 2.2x more likely than Black students to reach proficiency. These disparities also appear when looking at IEP status一students without IEPs were twice as likely to have met math proficiency standards, compared to students with IEPs.[3] Endnote details Former ELs were more than twice as likely to be proficient in math as Current ELs and 1.4x more likely than Never ELs. We see much smaller differences in math proficiency by gender; female students’ math proficiency rate was 2 percentage points higher than males. This finding is noteworthy given that, at the national level, boys outperformed girls on 8th grade math assessments in 2023.
Performance was higher across the board for ELA, with an overall proficiency rate of 65 percent. However, when we filter by neighborhood income, race/ethnicity, and IEP status subgroups, similar patterns of inequity appear. Notably, the gender gap is greater for ELA than math; female students’ ELA proficiency rates were 9 percentage points higher than male students. Former ELs were substantially more likely to be proficient in ELA than Current ELs (2.8x) and somewhat more likely than Never ELs (1.2x). [4] Endnote details
Big Questions:
- What experiences—before and during middle school—help explain the large disparities in outcomes described above? (To learn more about students’ access to educational opportunities, see our companion Spotlight post examining students’ exposure to rigorous curricula, non-exclusionary discipline, and a supportive school climate.)
- What strategies hold the most promise for improving attendance among students with IEPs, Black and Latinx students, and students from low-income neighborhoods?
- How did the Covid-19 pandemic affect the academic trajectories of students in this cohort (i.e., students who were in 5th grade when Covid began)? Did gaps in academic engagement and performance get bigger relative to earlier or later cohorts of middle schoolers?
- What makes Former ELs so successful? What can we learn from the experiences of Former ELs to help improve outcomes for Current ELs?
- Why doesn’t the recent gender disparity in math performance at the national level appear to be reflected in New York City?
- How have disparities in suspension rates evolved in NYC in recent years, particularly as NYCPS has discouraged exclusionary discipline and promoted alternative restorative justice practices?
- How would outcome trends change when analyzed by the intersection of student subgroups (e.g., race and gender and IEP status)?
This Spotlight post was authored by Erin Readling, James Kemple, and Chelsea Farley.
Suggested Citation
Readling, E., Kemple, J. and Farley, C. (2025) “Equity Indicators: NYC Middle School Outcomes by Race/Ethnicity, Neighborhood Income, Gender, and IEP Status.” Spotlight on NYC Schools. Research Alliance for New York City Schools.
Endnotes
- Our categories for gender (“male” and “female”) are based on gender marker data collected by NYC Public Schools. Students are able to change their gender marker in their permanent record with parental approval. Gender marker X – Neither Female nor Male (e.g. identifies as non-binary, gender expansive, or gender fluid) became an option in 2022-23, but because this set of analyses follow a cohort of students who enrolled in NYC middle schools in their 6th grade year (2019), we do not have an X subgroup. Neighborhood income categories are as follows: Affluent = median household income in the top 20th percentile of all NYC Census tracts (>$110,250); Higher Income = median household income between the 50th and 80th percentile ($74,696-$110,250); Modest Income = median household income between the 20th and 50th percentile ($47,500-$74,695); and Low Income = median household income in the bottom 20th percentile(< $47,500). EL Status is based upon whether a student was receiving English language services upon entry in their 6th grade year. The EL Status categories are as follows: Never EL: has never received EL services, Current EL: was receiving EL services at the start of 6th grade, Former EL: was not receiving EL services at the start of 6th grade but was at some point in the past. IEP Status is based upon whether a student had an IEP upon entry in their 6th grade year. The sample of students with IEPs includes those identified for special education services that are included in or are offered in addition to education provided in general classroom settings. The sample does not include students enrolled in District 75 schools or who receive services primarily or exclusively in settings comprised of students with disabilities. Outcomes likely vary significantly by IEP classification. Learn more about IEP classifications in NYC. ↩
- In our sample, 51 percent of students took the annual math exam in 2023. The majority of those who did not were exempt due to taking the Algebra regents exam in its place. ↩
- Some students with IEPs take the New York State Alternative Assessments and are therefore not represented in this analysis. ↩
- EL students who have been in the United States for less than a year are exempt from taking the New York state ELA exam, and are therefore not represented in this analysis. ↩
Figure Notes
Attendance Dashboard
Source: Research Alliance calculations based on data obtained from NYC Public Schools.
Notes: Attendance reflects students’ average attendance rate in Grade 8. Chronic absentee indicates that students’ attendance rate was less than 90 percent, meaning they missed more than 18 days of the school year.
Suspension Dashboard
Source: Research Alliance calculations based on data obtained from NYC Public Schools.
Notes: Suspension rates reflect the percentage of students who are suspended one or more times during grades 6-8.
GPA Dashboard
Source: Research Alliance calculations based on data obtained from NYC Public Schools.
Notes: Our measure reflects the percentage of students who have an average grade of 85% or higher in their scheduled Grade 8 year.
Test Scores Dashboard
Source: Research Alliance calculations based on data obtained from NYC Public Schools.
Notes: Math/ELA % proficiency rate refers to the percentage of students who score a 3 or 4 on the New York State annual assessments.