In this part of the series (Take a look at part 1: “What Disproportionality Is and Why it Matters“ if you haven’t yet.), we take a closer look at New York City Public School discipline data (2017-2018) to help us illustrate the glaring inequities for the sub-groups which have been marginalized by a system infested with policies and practices that perpetuate inequity.
We can best measure existing disproportionality by looking at Principal and Superintendent Suspension data. A Principal Suspension is a removal from the classroom by the teacher and can last up to 5 school days whereas Superintendent Suspension requires formal proceeding and the suspension can range from 6 days to 180 days depending on the infraction.
Tools Used to Assess Disproportionality
We can dig deeper into disproportionality by utilizing three prominent tools: Composition Index, Risk Index, and Relative Risk Ratio. Below, we define these tools and analyze actual New York City data to highlight the current presence of disproportionality.
Composition Index
Composition Index is the enrollment of specific race/ethnicity in comparison to the overall student enrollment. For example, if 1,700 Asian students are enrolled in a building out of a total of 21,700 students, the enrollment composition for Asians is around 8 percent. Composition indexes are used to determine if a particular group is over- or under-represented in a specific outcome.
Composition Table 1 shows the compositions of student enrollment, along with Principal and Superintendent Suspensions. A within race comparison tells us that even though Black students represent a total of 26.0 percent of the district enrollment they represent 43.5 percent of the total Principal Suspensions and 51.6 percent of Superintendent Suspensions.
In Composition Table 2, we focus on students with disabilities (SWDs)—the unlisted comparison group is general education students. We also include male students—the unlisted comparison group is female students. Although SWDs make up 19.7 percent of the total district enrollment, they receive 38.8 percent of Principal Suspensions and 43.4 percent of Superintendent Suspensions. NYC Public Schools have 51.4 percent male students enrolled; however, they are suspended at a much higher rate than their female counterparts.
Risk Index
Risk Index, also referred to as Risk, is a within-group comparison. More specifically, it refers to total referrals or suspensions of a specific subgroup in comparison to total enrollment of that specific subgroup.
The following table shows that a total of 16,765 Black students were involved in the disciplinary action out of a total of 294,678 Black enrollments. The Risk Index for the students of this sub-group stands at 5.7 percent. In other words, on average, every 100 Black students receives 6 suspensions, whereas every 100 White students receives only 2 suspensions.
A comparison between SWDs and general education students shows that SWDs have a higher Risk Index at 6.6 percent. Being a male student in the district puts a student at 4.2 percent risk of receiving a suspension.
Relative Risk Ratio
Relative Risk Ratio, also referred to as Relative Risk, is the risk of one subgroup in comparison to the risk of all other subgroups to experience any disproportionate outcome. A Relative Risk Ratio of 1 means a subgroup faces no disproportionality and less than 1 means underrepresentation of a subgroup.
Using the example of multiple suspensions, the Relative Risk Ratio tells us that if you are a Black student in the district, you are 2.70 times more likely to receive multiple suspensions in comparison to all the other racial/ethnic subgroups. Also, SWDs are 3.43 times more likely to receive multiple suspensions in comparison to general education students. Similarly, male students in the district are 2.55 times more likely to receive two or more suspensions in comparison to their female counterparts.
The Sprawl of Disproportionality
There are many additional examples of the way disproportionality appears within the educational system. Below, we list several flagrant instances.
Multiple Suspensions
Multiple suspensions in NYC Public Schools are an example of a particular subgroups’ overrepresentation in disciplinary outcomes. Overall, in the 2017-18 school year, there was an increase of 4.7 percent for the total number of students involved in multiple suspensions in NYC Public Schools as compared to the 2016-17 school year.
An even closer look at the composition of multiple suspensions tells us that a whopping 45.8 percent of the total students involved in multiple suspensions or removals were SWDs. A race comparison tells us that 48.6 percent were Black and 38.6 percent of them were Latinx.

Duration of Superintendent Suspensions
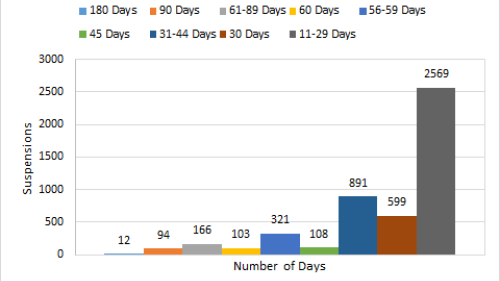
The following chart presents the number of Superintendent Suspensions along with durations.
The green bar, for example, reflects that each of 108 superintendent suspensions awarded during the year 2017-18 lasted 45 days. Black and Latinx students are given out-of-school suspensions or expulsions at a higher rate than their White peers for the same behavior1 and remain out of the building for a longer duration of time. The subjectivity in awarding out-of-school suspension and related duration is a glaring policy issue.

Suspension involving NYPD activity
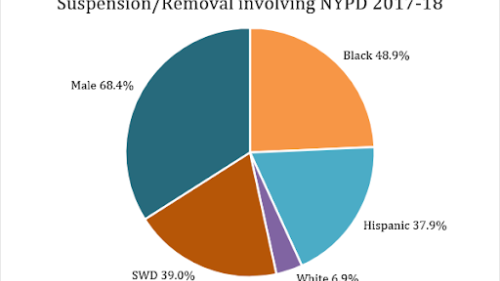
The chart on the left highlights the composition breakdown of the 3,331 suspensions/removals which involved the NYPD during the 2017-18 academic year. A total of 48.9 percent of these encounters involved Black students, 37.9 percent Latinx, yet only 6.9 percent were related to white students. We also note that 39.0 percent were SWDs, and there was an overall representation of 68.4 percent males.
These examples of disproportionality reflect the school-to-prison pipeline that exists within the educational system that criminalizes children primarily due to zero-tolerance policies and existing loopholes in the school code of conduct. These infractions are given out on a subjective basis (often linked to personal biases) and facilitate systemic criminalization of students.
Such policies are generally based on the assumption that removing students from schools when they behave disruptively will create an improved learning climate for others.2 But these policies are in turn pushing students of color—particularly black students—and other vulnerable groups such as SWDs towards imprisonment. This out of classroom time also sets these students behind upon returning to school. Students in schools with stricter discipline policies (e.g., zero tolerance) are less attached to their school which leads to tardiness, a leading cause of suspensions in most schools.3
The future of students is at stake when their precious learning time and innocence are funneled into the criminal justice system. Policies and practices need to be revisited to prevent this perennial injustice.
The Technical Assistance Center on Disproportionality (TAC-D) located within NYU’s Metro Center works with various districts cited for disproportionality across New York State. It initiates the process by first securing a school district’s support to address the cause and by assessing the district’s readiness to dismantle disproportionality.
Stay tuned for parts 3 and 4 of this blog series which will cover the ways in which TAC-D approaches this necessary work.
__
References:
[1] Skiba, R.J., Horner, R.H., Chung, C., Rausch, K., May, S.L, & Tobin, T. (2011). Race is Not Neutral: A National Investigation of African American and Latino Disproportionality in School Discipline. School Psychology Review 40(1), pp. 85-107.
[2] Casella, R. (2003). Punishing Dangerousness through Preventative Detention: Issutrating the Institutional Link Between School and Prison. New Directions for Youth Development 99, pp. 55-70.
[3] Tatum, B.T. (1992). Talking about Race, Learning about Racism: The Application of Racial Identity Development Theory in the Classroom. Harvard Educational Review 62(1), pp. 1-24.
About the Author
Jaspreet Kaur is a Senior Research Associate at the Technical Assistance Center on Disproportionality (TAC-D). As an experienced educator, analyst, and program manager, she works to support districts’ understanding of data and enhance system efficiency through customized tools and models.

