This post is the first in a regular series exploring indicators of equity in NYC schools as part of the COVID-19 and Equity in Education Project which is supported by the Bill & Melinda Gates Foundation and the AIR Equity Initiative.
Two years into the Covid-19 pandemic, we know that New York City’s education landscape has undergone seismic shifts, but we have little systematic evidence about how the dynamics of educational opportunity have changed for the City’s most vulnerable students. With the Equity Indicators project, the Research Alliance will be taking stock of the City’s equity and opportunity landscape in the years leading up to the pandemic and then assessing changes that have occurred in the wake of multiple upheavals connected to Covid-19. Each of the quantitative measures we’ll be examining is aligned with recommendations from the National Academies of Sciences, Engineering and Medicine (2019), and is an important indicator of how equitably New York City is serving the diversity of students who call it home.
The Equity Indicator series will focus on disparities that we observe along different dimensions of students’ backgrounds, such as race and ethnicity, neighborhood poverty, or being eligible for special education or English Learner services. These are dimensions along which systemic and structural factors—including implicit and explicit racism—limit access to opportunity for some students, while facilitating access for others. You can read more about the scope of the project and our aspirations for it on the Developing Equity Indicators for NYC Schools project page.
Previous research by the Research Alliance shows that educational outcomes for all NYC students were improving in the decade leading up to the pandemic—with gains across almost every indicator of educational progress from early childhood through college. However, this work also shows that disparities by race/ethnicity, neighborhood income, and other student characteristics have persisted despite the City’s ongoing focus on ameliorating these inequities.
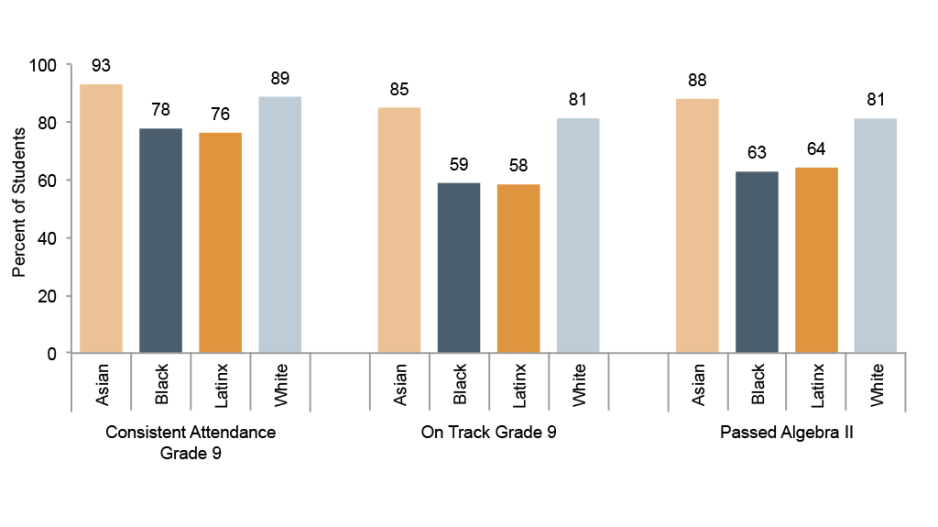
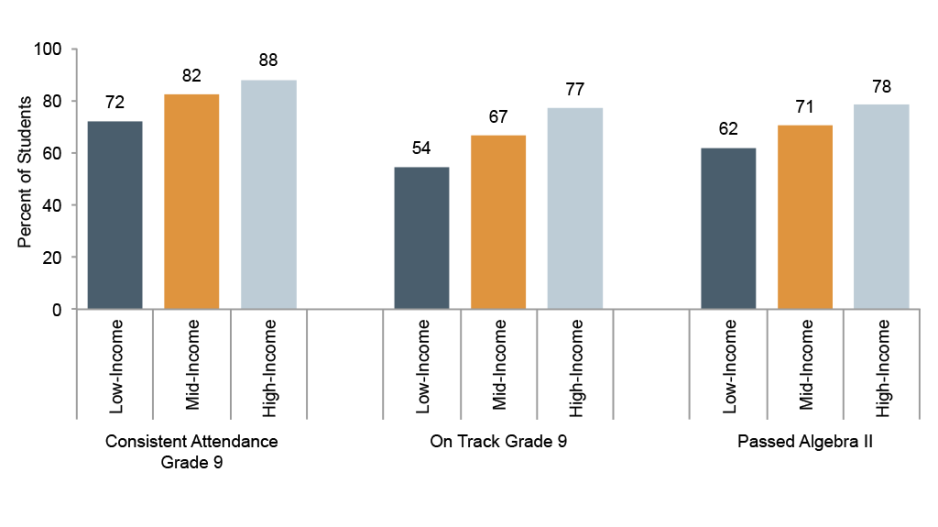
Figures 1 and 2 illustrate these disparities for academic progress and engagement outcomes linked to high school graduation and post-secondary preparation. Our sample includes three cohorts of students who began ninth grade between 2013 and 2015[i], the last cohorts to graduate prior to the start of the pandemic. Consistent with our previous work, we find that students from low-income neighborhoods[ii] and Black and Latinx students were less likely to have consistent attendance in ninth grade[iii] or to be on track at the end of ninth grade[iv] than their higher-income and White and Asian peers. Similarly, by the end of their fourth year of high school, they were less likely to have passed Algebra II, a key indicator of college readiness.[v] (See detailed figure notes at the end of this post.)
Figure 1: Academic Engagement and Progress by Race/Ethnicity

Figure 2: Academic Engagement and Progress by Neighborhood Poverty

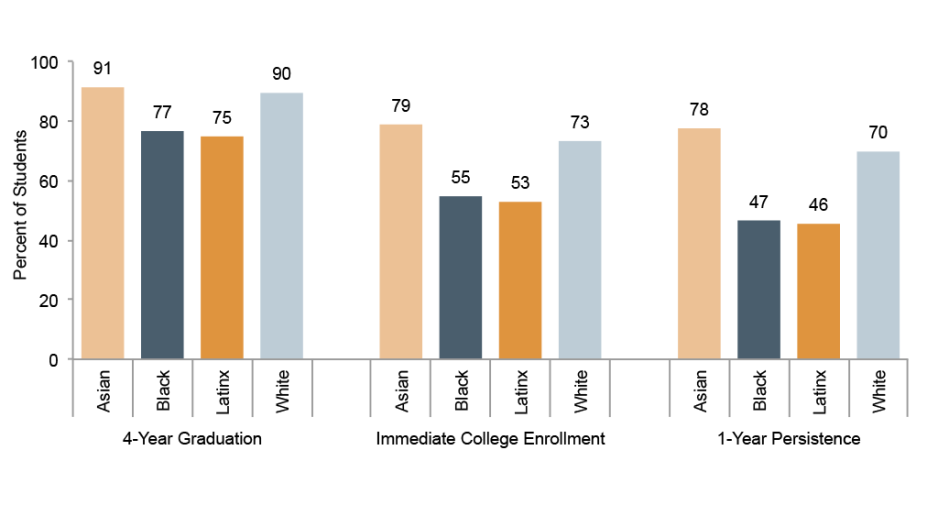
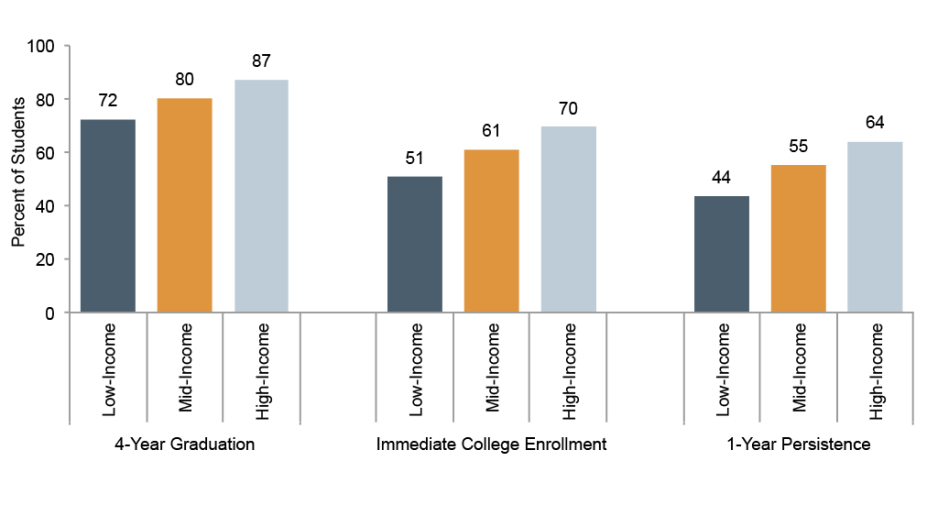
These disparities in academic progress during high school are also reflected in differences in high school graduation and college enrollment outcomes associated with race/ethnicity and neighborhood poverty (Figures 3 and 4). While the majority of NYC students in these cohorts graduated from high school in four years, for instance, lower-income and Black and Latinx students were less likely to do so. These gaps were even larger for immediate college enrollment and persistence through one year of college.[vi]
Figure 3: High School Graduation and College Enrollment by Race/Ethnicity

Figure 4: High School Graduation and College Enrollment by Neighborhood Poverty

Disparities in high school graduation and college access are well recognized. But in policy and public reporting, there has been much less emphasis on the differences in educational opportunities that lead to these unequal outcomes. More information about the opportunities and resources available to different groups of students—from early childhood education through elementary, middle, high school, and beyond—is crucial for ensuring that all students have access to learning conditions that allow them to thrive.
The Equity Indicators project will dig into both opportunities and outcomes, with upcoming posts focused on access to rigorous coursework and a supportive school climate in high school. Together with other emerging work in the series, we believe these analyses will provide a better understanding of the mechanisms driving educational inequality and inform changes that can produce more equitable learning experiences for New York City students.
Big Questions Guiding the Series
- To what extent are the wide disparities we see in educational outcomes in high school explained by measurable differences in educational opportunities in middle and elementary school? What would it take to address these opportunity gaps?
- Are there existing conditions under which high schools have been able to achieve greater equity in opportunity or outcomes for Black and Latinx students or students from low-income communities?
- How have the changes that have occurred during the pandemic altered the prospects for the City’s most underserved students?
- To what extent do the disruptions over the last two years reveal ways to reimagine how students engage with our public school system?
At the end of the day, an indicator system is only valuable if it inspires action and fosters progress on the problems we are collectively trying to solve. As we continue to develop the Equity Indicators series, we look forward to working with community, school, and district leaders to ensure we are producing actionable information that helps advance equity system-wide.
This post was authored by Kristin Black and Kathryn Hill.
Endnotes
[i] In line with NYCDOE’s practice for reporting outcomes, students who eventually transfer out of the district are removed from the sample. Students who drop out remain in the denominator for all outcomes calculations.
[ii] This is based on the median household income in students’ residential census tracts in 9th grade. Students in the lowest quartile (25%) of tracts by this measure are considered to be in “low-income” neighborhoods while students in the highest quartile are considered to be in “high-income” neighborhoods. The medium-income category includes the 50% of students in the middle of the distribution based on median household income.
[iii] Consistent attendance is defined as attending more than 90% of days in a given school year—the inverse of the City’s chronically absent definition.
[iv] On-track for graduation at the end of 9th grade includes having completed ten credits and passing at least one of the five required Regents exams.
[v] Adelman, C. (2006). The Toolbox Revisited: Paths to Degree Completion from High School through College. Washington, DC: U.S. Department of Education.
[vi] We use an inclusive measure of persistence that includes any students from the 9th grade cohort who were enrolled in college in the second year after their expected graduation. It therefore includes students who enrolled immediately after high school and then returned the second year, as well as students who delayed graduation or enrollment. To read more about the rationale behind this wider definition of persistence, please see our report New York City Goes to College: New Findings and Framework.
Figure Notes
Source: Research Alliance calculations based on data obtained from the NYC Department of Education.
Notes: Total student n = 190,838. Low-Income n = 42,541; Mid-Income n = 97,326; High-Income n = 50,971; Asian n = 33,887; Black n = 51,436; Latinx n = 75,204; White n = 26,803. Data drawn from 499 high schools serving grades 9-12 or 6-12 between 2014 and 2016. District 75, 79, 88, and 84 (charter) schools are not included due to limited course data.
How to Cite this Spotlight
Black, K., Hill, K. 2022. "Introducing the Indicators of Education Equity Project." Spotlight on NYC Schools. Research Alliance for New York City Schools.

