

How Do NYC High School Outcomes Vary by Race/Ethnicity and Neighborhood Income?
Why Measure Equity?
In 2019, the National Academies of Sciences (NAS) published a framework for monitoring equity in American schools. The framework outlined a set of 16 indicators that could be used to track differences in students’ educational opportunities and outcomes—and “differences in the conditions and structures in the education system” that shape students’ odds of success. The NAS report argued that “a carefully chosen set of equity indicators can highlight disparities, provide a way to explore potential causes, and point toward possible improvements. Enacting change can be challenging, but it is nearly impossible if there is no information about existing problems.”
Over the next several years, interest in equity indicators grew in New York City and across the country, with efforts focused on education as well as other aspects of civic life. Examples included the Equity NYC Report, state-level work conducted by EdTrust New York, a CUNY-led, Rockefeller-Foundation-funded effort being implemented in multiple cities, and the Equity in Education Dashboard developed by the U.S. Department of Education's National Center for Education Statistics (NCES).
Recently, though, criticism of equity-focused initiatives has become increasingly vocal and influential. In January, a much-discussed presidential executive order outlined the “termination” of all “diversity, equity, inclusion, and accessibility” policies, programs, and activities in the Federal government. Almost immediately, contracts and grants were cancelled, employees were fired, and research was scrubbed from government websites, including the quiet removal of the NCES equity dashboard. [1] Endnote details
Efforts to understand, measure and advance equity in education are central to the Research Alliance’s mission. This work allows us to grapple with the very real legacy of racial and socioeconomic segregation and unequal educational opportunities dating back to the country’s founding. Measuring equity provides information we can use to ensure that all students have access to high-quality schools that nurture their growth and development and prepare them to be successful, engaged citizens.
Through the Research Alliance’s longstanding partnership with NYC Public Schools, and with support from Carnegie Corporation of New York, we have been working over the last several years to develop a comprehensive set of equity indicators for NYC’s education system.[2] Endnote details This project provides a model for how researchers, funders, and local education systems can work together to overcome practical barriers to equity indicator development (e.g., a lack of accessible, relevant data; inadequate resources to support data management and analysis; and challenges operationalizing indicators, particularly when it comes to measuring opportunity). As we have begun to see, this work can inform policy decisions and enhance the public's understanding of school performance, generating actionable insights for teachers, administrators, students, and families alike.
How Equitable Are Student Outcomes in NYC High Schools?
Our equity indicator series starts with a look at students’ high school experiences and outcomes. Arguably, on-time high school graduation and preparation for the transition to postsecondary education and careers are the most important outcomes of public education—both because they predict success later in life and because they signal something about students’ cumulative experiences in school.
Below, we examine attendance, on-track rates, graduation rates, and college enrollment for NYC’s class of 2023, focusing on differences by race/ethnicity and neighborhood income. An accompanying post looks at measures of high school opportunity related to advanced coursework, non-exclusionary discipline, and a supportive learning environment for this same cohort of students. Future posts will present equity indicators for middle and elementary school, and will examine the experiences of additional student subgroups (e.g., students with disabilities and English learners). We aim to publish a comprehensive “State of NYC Schools Equity Report” in late 2025.
NAS-Recommended Indicators of Equity in Educational Outcomes
- Disparities in Academic Readiness (Kindergarten)
- Disparities in Self-Regulation and Attention Skills (Kindergarten)
- Disparities in Engagement in Schooling
- Disparities in Performance in Coursework
- Disparities in Performance on Tests
- Disparities in On-Time High School Graduation
- Disparities in Postsecondary Readiness
Bolded indicators are covered in this post.
Attendance
(NAS Engagement in Schooling Indicator)
Extensive research shows that consistent attendance is crucial for academic success, including documented effects on the odds of graduating high school. The figure below allows you to view attendance or chronic absenteeism by students’ race/ethnicity or by the average income level in students’ home neighborhood. Our analysis includes 61,834 students who started in high school in New York City in 2019 and were scheduled to graduate in 2023.
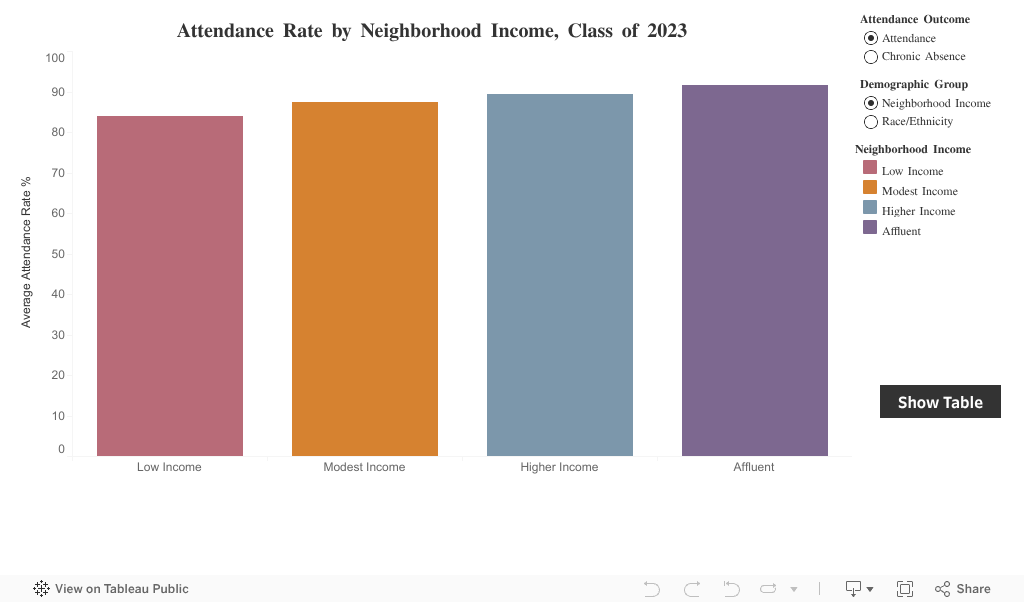
Looking at attendance, we see meaningful differences by race/ethnicity and income. Black and Latinx students’ average attendance rates, across four years of high school, hovered around 85 percent, compared with 93 percent for Asian students, 91 percent for White students and 89 percent for students in the “Other Race/Ethnicity” category (which includes Native American and multi-racial students, as well as students with no race/ethnicity listed).
Notably, only students in the most affluent neighborhoods had attendance rates above 90 percent—frequently seen as a benchmark of sufficient academic engagement. Students living in the poorest neighborhoods averaged 84 percent attendance, meaning they missed approximately 115 days of school over four years, from 9th through 12th grade.
When we switch the graph to show chronic absenteeism, we see larger differences associated with race/ethnicity and neighborhood income. This analysis defines students as chronically absent if their attendance rate was below 90 percent on average (missing 18 days or more per year). Black and Latinx students were nearly twice as likely as White students—and almost two and a half times more likely than Asian students—to be chronically absent during high school. Chronic absentee rates in the poorest neighborhoods soared to nearly 50 percent, compared with 38 percent in modest income neighborhoods, 31 percent in higher income neighborhoods, and 23 percent in affluent neighborhoods.
Taken together, these findings paint an alarming picture of NYC students’ academic engagement. In the wake of the COVID-19 pandemic, schools in NYC (like many other places across the country) have struggled to reestablish consistent attendance patterns. Not only are rates of chronic absenteeism high across the board, but there are pronounced inequities by race and class. The size of these gaps suggests that improving attendance rates, particularly for Black, Latinx and low-income students, should be central to the City’s education policy agenda. These efforts would benefit from additional research examining the causes of chronic absenteeism in the post-Covid era and potential new solutions.
Progress through High School and Into College
(NAS Performance in Coursework, Performance on Tests, On-Time Graduation and Post-Secondary Readiness Indicators)
The next figure summarizes students’ progress through high school, including on-track rates in 9th, 10th, and 11th grades, on-time graduation rates, and college enrollment. On-track rates are based on how many academic credits students have accumulated as well as the number of Regents exams they’ve passed, making these a good proxy for the NAS “Performance in Coursework” and “Performance on Tests” indicators.
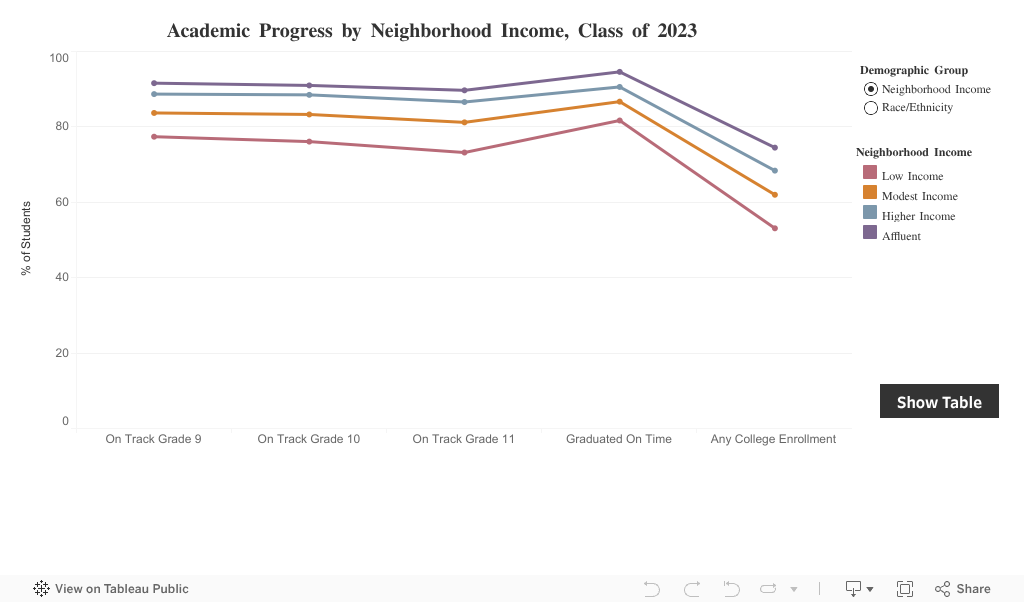
Again, the graph reveals large differences by race/ethnicity and neighborhood income. Throughout high school, Asian and White students were significantly more likely to be on track than Black and Latinx students—with gaps that grew larger over time. For instance, in 9th grade, the difference between Asian and Latinx students was 13.5 percentage points; this increased to more than 14 percentage points in 10th grade and peaked at about 16 percentage points in 11th grade. By the end of high school, the gaps closed somewhat, with Asian and White students around 10 percentage points more likely to graduate than Latinx and Black students. The differences widen again when it comes to college enrollment. In 2023, about 80 percent of Asian students and 74 percent of White students enrolled in some form of college, compared to 56 percent of Black students and 53 percent of Latinx students.
The patterns are similar when we look at differences by neighborhood income—with gaps widening between 9th and 11th grade, shrinking somewhat for on-time graduation, and greatly expanding for college enrollment. Ultimately, students from low-income neighborhoods were about 21 percentage points less likely than those from the highest income neighborhoods to enroll in college.
As large as this gap is, it conceals important differences in the kinds of colleges that students are attending. The final figure below presents two- and four- year college enrollment by race/ethnicity and neighborhood income.
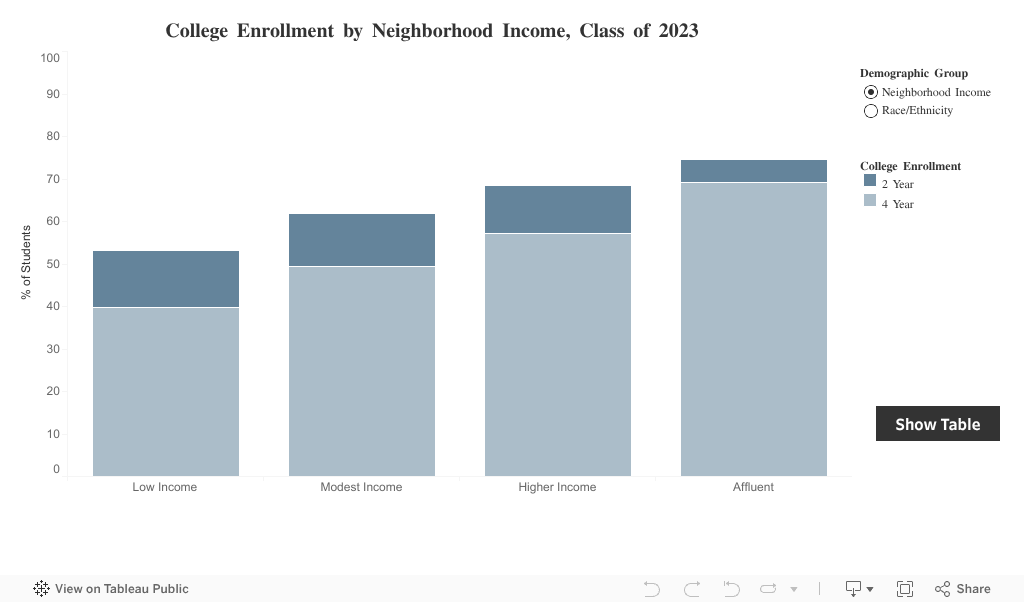
As shown in the figure, Black and Latinx students were about twice as likely as White and Asian students to enroll in a two-year college. At the same time, they were considerably less likely to enroll in a four-year school. Similarly, students from low-income neighborhoods were comparatively more likely to enroll in a two-year college and less likely to enroll in a four-year program. These differences matter because attending a four-year school is associated with higher completion rates and greater lifetime earnings. On the other hand, it is important to recognize that two-year programs provide notable benefits to many students who would not have been able to attend college otherwise.
Big Questions:
- What experiences—before and during high school—help explain the large disparities in outcomes described above? (See our companion Spotlight post examining students’ exposure to rigorous curricula, non-exclusionary discipline, and a supportive school climate.)
- What strategies hold the most promise for improving attendance among Black and Latinx students and students from low-income neighborhoods?
- What strategies support college access and success, particularly for Black and Latinx students and those from lower-income neighborhoods?
- How do patterns of two- and four-year college enrollment impact longer-term degree completion and career outcomes for different student groups?
- How did the Covid-19 pandemic affect the academic trajectories of students in this cohort (i.e., students who were in 9th grade when Covid began)? Did gaps in academic engagement and performance get bigger relative to earlier or later cohorts of students?
- What other student subgroups should we be paying attention to, in order to get a fuller picture of educational equity in NYC schools?
This Spotlight post was authored by Chelsea Farley, James Kemple, and Erin Readling.
Suggested Citation
Farley, C., Kemple, J., and Readling, E. (2025) “How Do NYC High School Outcomes Vary by Race/Ethnicity and Neighborhood Income?” Spotlight on NYC Schools. Research Alliance for New York City Schools.
Endnotes
- The link, https://nces.ed.gov/programs/equity/ now redirects to https://nces.ed.gov/surveys/annualreports, which includes no mention of the word “equity.” ↩
- A prior iteration of this work was supported by the COVID-19 and Equity in Education Project, with funding from the Bill & Melinda Gates Foundation and the AIR Equity Initiative. We are grateful to these partners for the crucial role they played in getting the Research Alliance’s equity indicators project off the ground. ↩
Figure Notes
Attendance and Chronic Absence by Race/Ethnicity and Neighborhood Income
Source: Research Alliance calculations based on data obtained from NYC Public Schools.
Notes: Attendance reflects students’ average attendance rate over four years (grades 9-12). Chronic absentee indicates that students’ average attendance rate over four years was less than 90 percent. Neighborhood income categories are as follows: Affluent = median household income in the top 20th percentile of all NYC Census tracts (>$110,250); Higher Income = median household income between the 50th and 80th percentile ($74,696-$110,250); Modest Income = median household income between the 20th and 50th percentile ($47,500-$74,695); and Low Income = median household income in the bottom 20th percentile(< $47,500).
Academic Progress by Race/Ethnicity and Neighborhood Income
Source: Research Alliance calculations based on data obtained from NYC Public Schools and the National Student Clearinghouse.
Notes: On-track for 9th grade includes students who earned more than 10 credits and passed at least one Regents exam by the end of 9th grade; on-track for 10th grade includes students who earned more than 22 credits and passed at least two Regents exams by the end of 10th grade; on-track for 11th grade includes students who earned more than 33 credits and passed at least three Regents exams by the end of 11th grade. On-time graduation includes students who earned a New York State Regents diploma by August after their fourth year of high school. College enrollment includes students who enrolled in any college in the fall after their scheduled high school graduation. See the previous figure note for neighborhood income categories.
College Enrollment by Race/Ethnicity and Neighborhood Income
Source: Research Alliance calculations based on data obtained from NYC Public Schools.
Notes: College enrollment includes students who enrolled in a two- or four-year college in the fall after their scheduled high school graduation. See the first figure note for neighborhood income categories.