

How Do NYC High School Opportunities Vary by Race/Ethnicity and Neighborhood Income?
In 2019, the National Academies of Sciences (NAS) published recommendations for monitoring educational equity. Building on these recommendations, the Research Alliance has been working to develop a comprehensive set of equity indicators for NYC schools. We started by looking at students’ high school outcomes (e.g., attendance, graduation rates, college enrollment), which provided a rough sense of their cumulative experiences in NYC’s education system. But information about outcome gaps is of limited use if not accompanied by an assessment of disparities in resources and opportunities. Students’ experiences can be dramatically different depending on the schools they’ve attended and how learning opportunities within those schools are structured. As reflected in the NAS framework, examining differences in the opportunities available to students can paint a more accurate picture of the challenges that exist in creating a system of schools that will enable all students to reach their full potential.
While information about student outcomes is often publicly reported, this is not the case for many of the opportunity indicators proposed by NAS. As we have found over the last several years, defining and operationalizing indicators of opportunity is a complex undertaking. Challenges include identifying and obtaining relevant data and developing measures that do any kind of justice to something as nuanced as “effective teaching” or “curricular breadth.” Further complicating matters, opportunities can be assessed in relative or absolute terms. A relative approach looks at the overall distribution of opportunities and designates schools as low-, medium- and high-opportunity environments based solely on where they fall in relation to other schools. An absolute approach requires determining what level of opportunity would be sufficient (e.g., how many AP courses are enough?) and then seeing if schools meet that standard. Finally, there is the question of whether or not specific opportunities are correlated with outcomes we have deemed important. Should we focus on opportunities that most strongly predict graduation rates, for example? Or take a broader view of the kinds of educational experiences we believe all children should have access to?
NAS-Recommended Indicators of Equity in Educational Opportunities
- Disparities in Students’ Exposure to Racial, Ethnic, and Economic Segregation
- Disparities in Access to and Participation in High-Quality Pre-K
- Disparities in Access to Effective Teaching
- Disparities in Access to and Enrollment in Rigorous Coursework
- Disparities in Curricular Breadth
- Disparities in Access to High-Quality Academic Supports
- Disparities in School Climate
- Disparities in Nonexclusionary Discipline Practices
- Disparities in Nonacademic Supports for Student Success
Bolded indicators are covered in this post.
Below we present our framework for measuring opportunity in the equity indicators project—including dimensions captured in the current analysis, and equally important dimensions of opportunity that we aim to address in future work. We then turn to a discussion of findings on three school-level measures of opportunity, related to academic rigor, school discipline, and school climate.
Our Framework for Measuring Opportunity
Over the course of the last year, the Research Alliance team has had extensive conversations with school, community, and district leaders, and with students, parents, and educators, which have underscored both the importance and the complexity of measuring educational opportunities. Informed by these conversations, as well as the NAS recommendations, we propose the following framework for assessing equity in opportunity in NYC schools:
1. How do differences between schools curtail or support opportunities?
We know that schools offer varying levels of opportunities (e.g., different amounts of advanced coursework, different approaches to discipline, different kinds of relationships between students and staff). We also know that NYC schools are highly segregated by race and class. In this post, we seek to identify high-, medium- and low-opportunity environments and then assess the extent to which they are available to students from different race/ethnicity and socioeconomic subgroups.
We use a hybrid of the relative and absolute approaches to measuring school-level opportunity. This involves assessing the distribution of opportunity across all NYC high schools for an earlier cohort of students (the class of 2019) to establish baseline definitions of low-, medium- and high-opportunity schools; we then stick with those predetermined thresholds for each subsequent year of analysis. Importantly, this approach will allow us to measure progress in the system over time—that is, are more schools moving into the “high opportunity” category?
2. How do differences within schools curtail or support opportunities?
In addition to the overall levels of opportunity that students may have access to across schools, there can also be marked inequities within the same building. For instance, some groups of students might be more likely to take the advanced courses that are offered, or less likely to be suspended. Future spotlight posts will examine these within-school differences in opportunity. Ultimately, we aim to use both quantitative and qualitative data to assess the distribution of opportunities within schools.
3. How do prior academic experiences curtail or support opportunities?
Students’ opportunities within a particular grade level are highly dependent on their previous academic experiences and outcomes. While our current analysis focuses on high schools, forthcoming posts will examine equity in NYC middle and elementary schools.
4. How do family, neighborhood, and community resources curtail or support opportunities?
Larger social and economic inequalities shape students’ academic trajectories in powerful ways. Prior Research Alliance work has highlighted challenges associated with homelessness and neighborhood policing, to name just two examples. A new project, Disrupting School Pushout, is exploring relationships between neighborhood-level opportunity structures, resource allocation in schools, and students’ odds of graduating. Keep an eye out for future reports and Spotlight posts from this project!
How Do Differences Between NYC High Schools Curtail or Support Opportunities?
The remainder of this Spotlight post focuses on opportunities available to students who entered high school in 2019 and were scheduled to graduate in 2023. We present three opportunity measures–Advanced Coursework, Limited Use of Suspensions, and Supportive School Climate. As noted, this analysis examines levels of opportunity across schools, to understand how the experiences and resources available to students differ based on the characteristics of the schools they attend. The analysis focuses on differences by race/ethnicity and neighborhood income. Future work will address equity in opportunities for English learners and students with disabilities.
Advanced Coursework
(NAS Disparities in Access to Rigorous Coursework Indicator)
The opportunity to take rigorous coursework is intended to build knowledge and skills that will help students succeed in college and careers. Notably, some advanced classes also have the benefit of allowing students to earn college credit while they are still in high school. But schools vary widely in the amount of such coursework offered. The interactive graph below allows you to see the proportion of students who attended low, moderate, and high academic opportunity schools, either by race/ethnicity or by neighborhood income. We measured academic opportunity by counting the number of advanced course sections offered in a school (including AP, IB, Early College, dual enrollment, and other college-level courses) and then controlling for the school size.
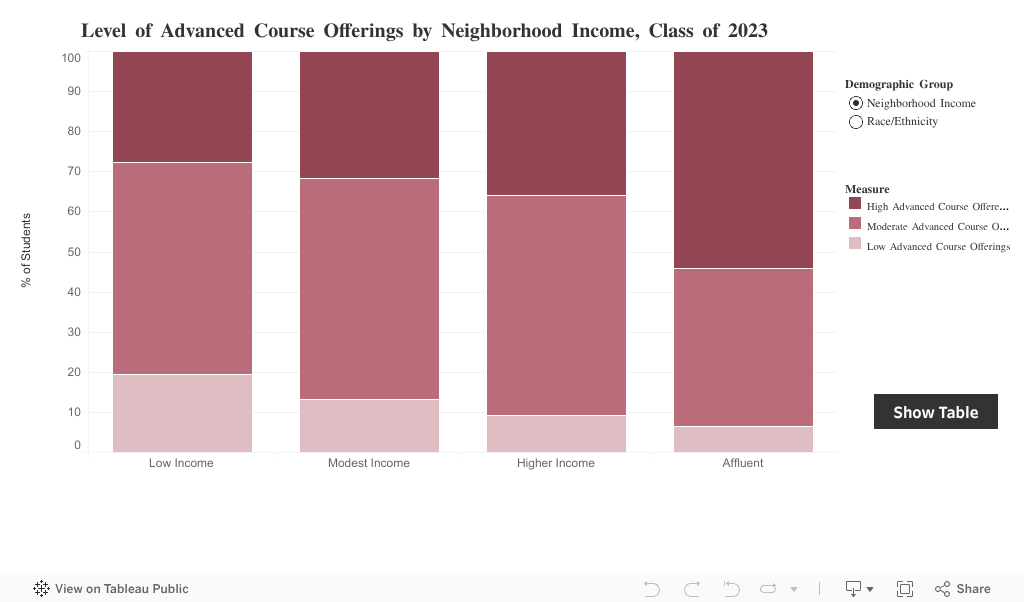
Looking at race/ethnicity, we find that Latinx students are the most likely to attend low opportunity schools at 18 percent and the least likely to attend high opportunity schools at 27 percent. The numbers are slightly better for Black students, with 14 percent attending a low opportunity school and 33 percent attending a high opportunity school. White and Asian students had the most access to high academic opportunity schools, at around 43 percent, and were the least likely to attend low opportunity schools, at around 8 percent.
Differences become even more pronounced when looking at Neighborhood Income. As income levels increase, the likelihood of attending a high opportunity school also increases. Students in the most affluent neighborhoods were approximately twice as likely to attend high opportunity schools as students in the poorest neighborhoods (54 vs 28%). Conversely, only 6 percent of students from affluent neighborhoods attended low opportunity schools, compared with 20 percent of students from low-income neighborhoods.
Limited Use of Suspensions
(NAS Disparities in Nonexclusionary Discipline Practices indicator)
Extensive research has highlighted the negative impacts of “exclusionary discipline,” which removes students from the classroom, sometimes for minor infractions, causing them to miss out on valuable instructional time. Studies show that suspensions have a negative effect on learning outcomes, such as GPA and test scores, and increase the likelihood of a student dropping out. In light of these issues, many schools—and NYCPS leadership—have moved away from suspensions toward a more “non-exclusionary” approach, often involving restorative practices.
The next analysis uses the percentage of disciplinary incidents that turn into a suspension (sometimes called the “conversion rate”) as a proxy for the use of exclusionary discipline in every school. Again we sort schools into high, moderate and low opportunity categories. In this case, high opportunity = low use of suspensions, and low opportunity = high use of suspensions.
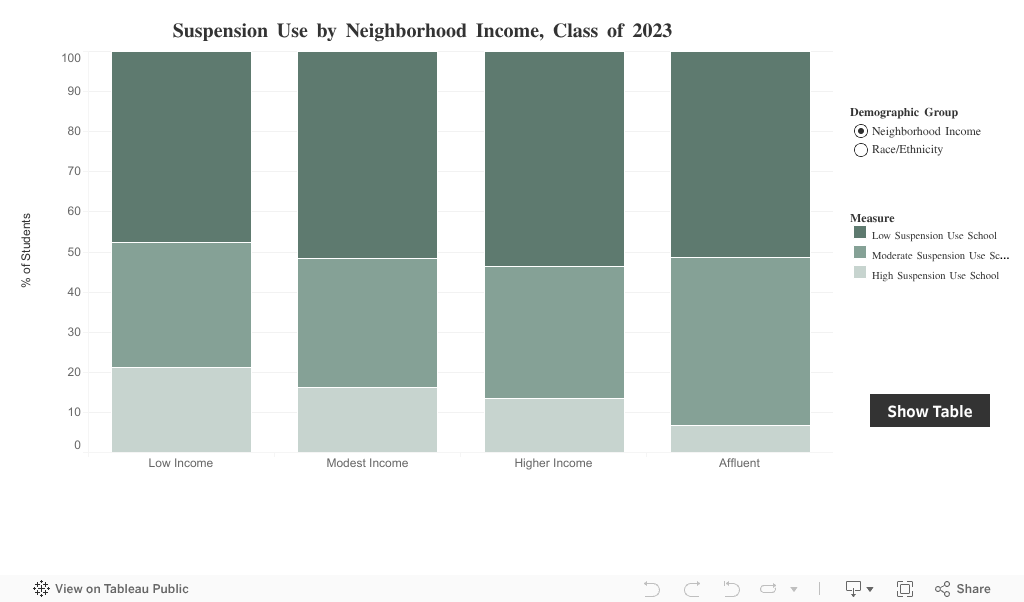
Our analysis shows that most students across the system attend a school with low or moderate use of suspensions. Yet, even after years of work aimed at reducing exclusionary discipline, Latinx and especially Black and low-income students are still wildly overrepresented in the schools that are most likely to issue a suspension in response to a disciplinary incident. The figure shows that Black students were four times more likely to attend a low opportunity / “high suspension use” school compared to White students (25% vs. 6%). Latinx students were three times more likely than White students to attend a high suspension use school (18%). Looking at neighborhood income, similar patterns emerge. Students from poor neighborhoods were three times as likely to attend a high suspension use school, compared to their peers from affluent neighborhoods (21% vs. 7%). Focused efforts to develop effective, non-exclusionary approaches to discipline in these schools will be important for advancing equity for NYC students.
Supportive School Climate
(NAS “Disparities in School Climate” Indicator)
There is considerable evidence that a positive school climate supports students’ social and emotional well-being and academic outcomes. The figure below examines the proportion of students by race/ethnicity and neighborhood income who attend low, moderate and high opportunity schools based on our Supportive School climate indicator. This indicator was created by averaging each schools’ student survey responses to questions about relationships, belonging, safety, and student behaviors, throughout grades 9-12.
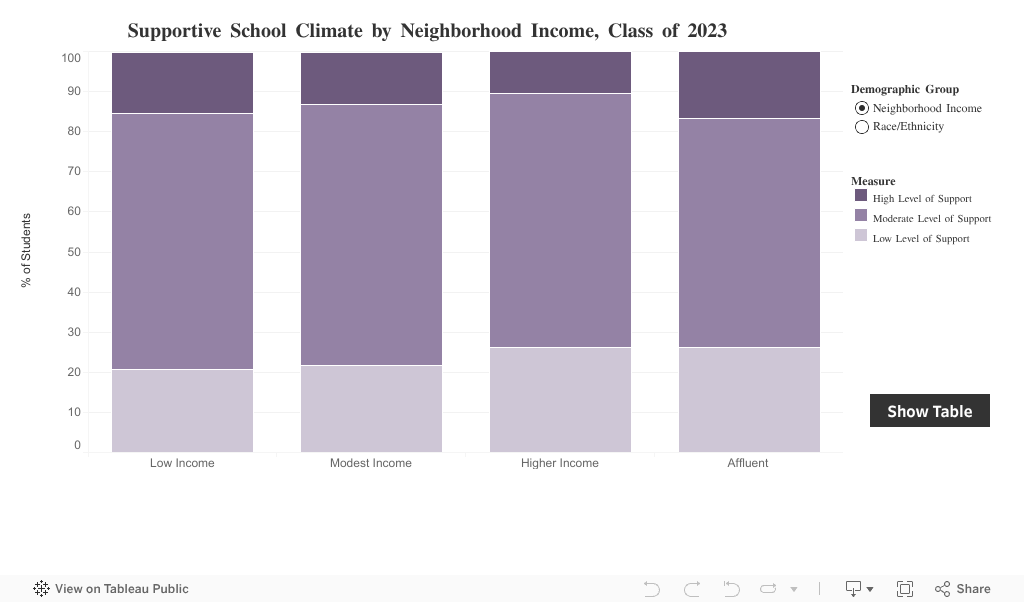
The figure shows that Black students were the most likely to attend low support schools, at 29 percent, and the least likely to attend high or moderate support schools, at 71 percent. The patterns for White, Asian and Latinx students are relatively similar to one another, with close to 80 percent of students attending schools in the high or moderate support category.
The analysis of differences by income reveals some interesting findings. Students from higher-income and affluent neighborhoods are the most likely to be enrolled in low support schools. Affluent students are also overrepresented in schools with the highest levels of support, as are students at the opposite end of the income spectrum.
As noted, these analyses focus on differences in the kinds of schools that students are enrolled in, on average. It is important to note that inequities also exist within schools. For instance, previous research has shown that Black students are more likely to be suspended than other students within the same school. Black and Latinx students also tend to rate the school climate differently than their White and Asian peers in the same school. Future posts in our Equity Indicators series will explore within-school differences for our three high school opportunity measures.
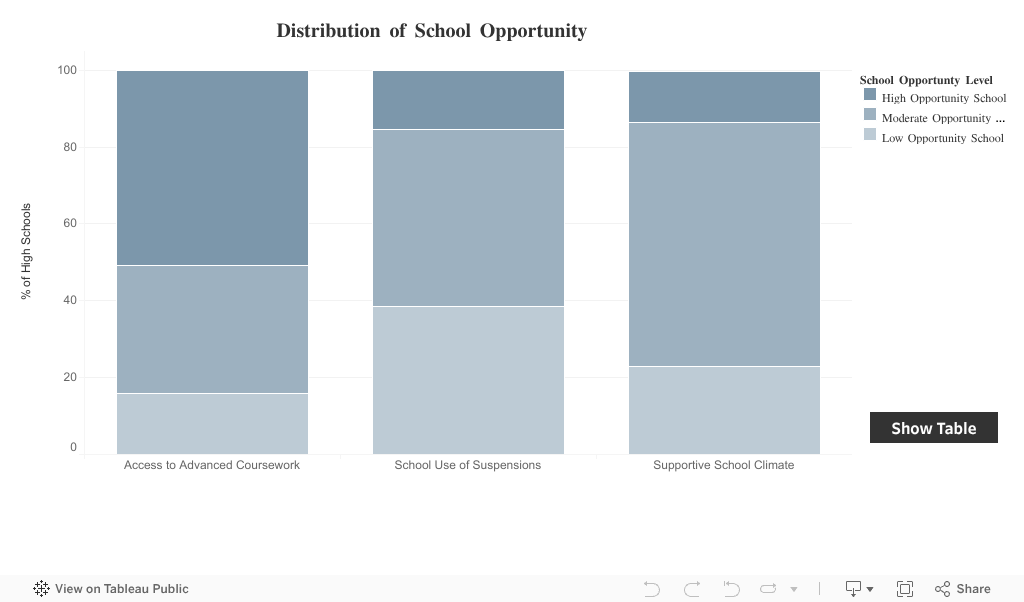
Our final figure presents an overview of the percentage of schools falling into the high, moderate and low opportunity categories for each indicator for the class of 2023:
Big Questions
- What would it take to offer more advanced classes in the low academic opportunity schools? What kinds of support would students need to ensure they can succeed in these classes, given varying levels of prior academic preparation? Within high academic opportunity schools, are some groups of students still underrepresented in advanced classes?
- Are there practices in place in high opportunity / low use of suspension schools that could be replicated elsewhere across the district? Within these schools, are certain students still more likely to be suspended? Which schools have made the most progress toward equitable, non-exclusionary discipline?
- What approaches are in place to foster a positive learning environment in the high support schools? Are there meaningful differences in how students within the same school perceive the learning environment? If so, what accounts for these differences?
This Spotlight post was authored by Chelsea Farley, James Kemple, and Erin Readling.
Suggested Citation
Farley, C., Kemple, J. and Readling, E. (2025) “How Do NYC High School Opportunities Vary by Race/Ethnicity and Neighborhood Income?” Spotlight on NYC Schools. Research Alliance for New York City Schools.
Figure Notes
Academic Opportunity by Race/Ethnicity and Neighborhood Income
Source: Research Alliance calculations based on data obtained from NYC Public Schools
Notes: This analysis includes 61,764 students who started in high school in New York City in 2019 and were scheduled to graduate in 2023. The Academic opportunity measure was created by dividing the number of students enrolled in a unique advanced course code (AP, IB, or early college class) by 25 to create a proxy for available advanced course sections. To control for the size of the school, the number of course sections was divided by the number of students in 11th and 12th grade (the years when students typically take advanced courses). High = Average 3.6 or more college course sections for every 25 students in Grades 11 and 12. Low = Fewer than 1.5 college course sections offered for every 25 students in Grades 11 and 12. Moderate = Between 1.5 and 3.6 college course sections offered for every 25 students in Grades 11 and 12. Neighborhood income categories are as follows: Affluent = median household income in the top 20th percentile of all NYC Census tracts (>$110,250); Higher Income = median household income between the 50th and 80th percentile ($74,696-$110,250); Modest Income = median household income between the 20th and 50th percentile ($47,500-$74,695); and Low Income = median household income in the bottom 20th percentile(<$47,500). "The Other Race/Ethnicity” category includes Native American and multi-racial students, as well as students with no race/ethnicity listed.
Suspension Use by Race/Ethnicity and Neighborhood Income
Source: Research Alliance calculations based on data obtained from NYC Public Schools
Notes: Suspension use was measured by the percentage of major and minor disciplinary incidents that resulted in a suspension over grades 9-12. High opportunity (low use of suspensions) = Fewer than 13 percent of minor incidents AND fewer than 59 percent of major incidents resulted in a suspension. Low opportunity (high use of suspensions) = More than 13 percent of minor incidents AND more than 59 percent of major incidents resulted in a suspension. Moderate opportunity (moderate use of suspensions)= Either 13 percent or more of minor incidents resulted in a suspension or 59 percent or more of major incidents resulted in a suspension.
Supportive School Climate by Race/Ethnicity and Neighborhood Income
Source: Research Alliance calculations based on data from the annual NYC School Survey.
Notes: Supportive school climate was determined by averaging student survey measures of support, belonging, safe environment, and safe behaviors over grades 9-12. Students rated each survey item on a scale from 1 to 4, with 4 being the most positive. High Opportunity/Support = Average response of 3.2 or higher; Low Opportunity/Support = Average response of 2.0 or lower. Moderate Opportunity/Support = Average response between 2.0 and 3.2.