

Education outcomes in New York City have improved dramatically for students of various backgrounds and abilities. Yet, as we documented in previous posts in this series, there are still large disparities associated with students’ race/ethnicity, socioeconomic status, and neighborhood. This post examines the relationship between students’ outcomes and the area of the City in which they live—and how, if at all, this relationship has changed over time.
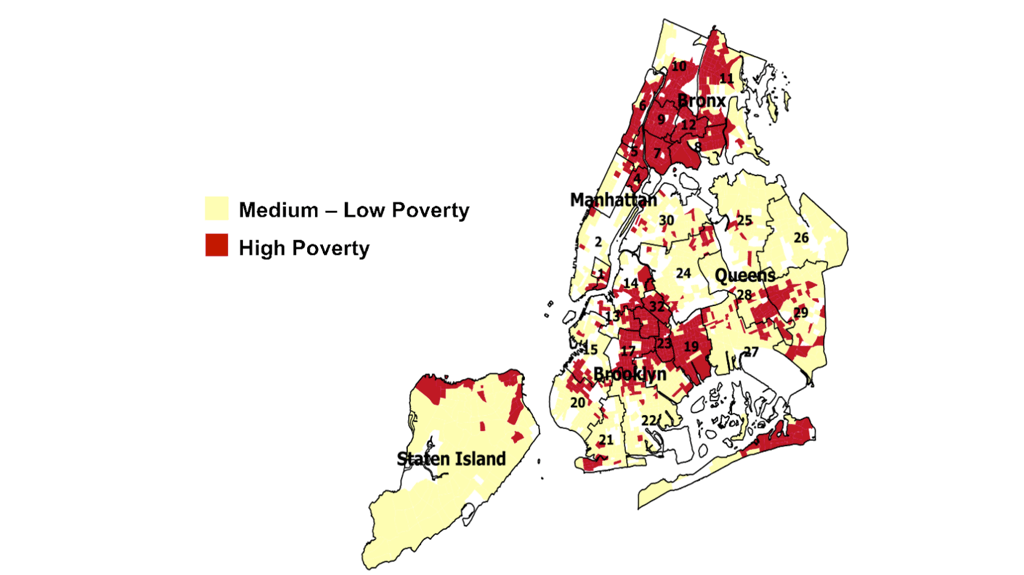
The map in figure 1 below highlights NYC census tracts with high rates of poverty in 2010 (the most recent year for which these data are available). We see areas of concentrated poverty in every borough, including broad swaths of central Brooklyn, upper Manhattan, and the Bronx, as well as smaller parts of Queens and Staten Island. How have students who live in these areas performed in school, relative to those from more affluent neighborhoods?
Figure 1: Map of High-Poverty Census Tracts, 2010
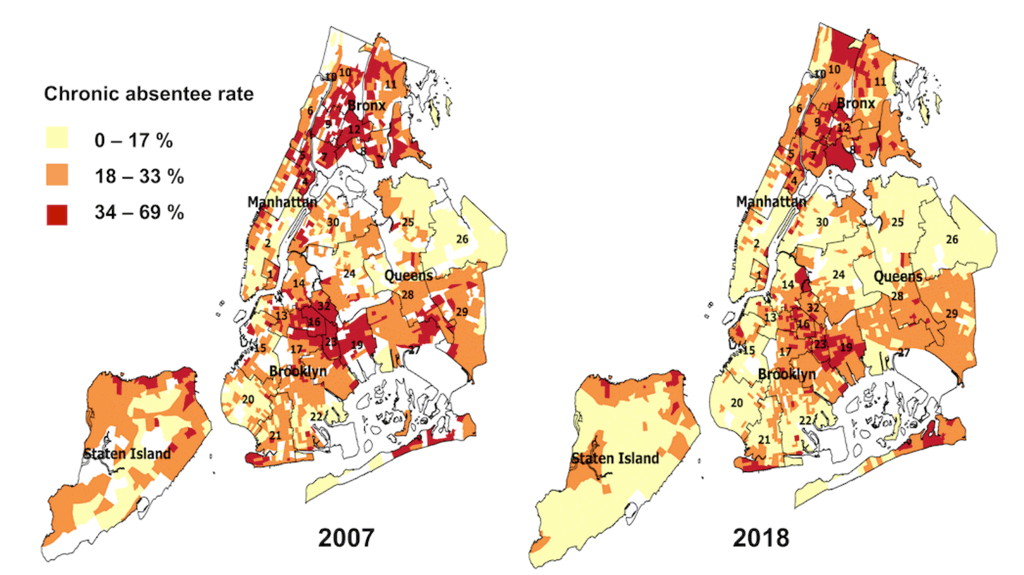
Let’s start by looking at chronic absenteeism. To succeed academically, students need to attend school. Research has clearly established the connection between attendance and academic performance. Figure 2 shows rates of chronic absenteeism by census tract in 2007 and 2018. The map from 2007 reveals large sections of the City where a third or more of all students were chronically absent (shown in red). These students missed at least 18 days of school that year—or nearly a month of instruction. It is somewhat shocking to see that so many students were missing so much school during this period. And while chronic absenteeism was most prevalent in high-poverty census tracts, it was not limited to those areas.
The second map in Figure 2 shows rates of chronic absenteeism in 2018. The picture is improved: Rates of chronic absenteeism are lower overall, and there are fewer census tracts where chronic absenteeism exceeded the one-third mark. Still, the tracts with the highest rates of chronic absenteeism were located in the poorest sections of the City—particularly in the Bronx and in districts 19 and 23 in Brooklyn (which serve the neighborhoods of Brownsville and East New York, and several large housing projects).
Figure 2: Map of Chronic Absentee Rates, 2007 and 2018, by Residential Census Tract
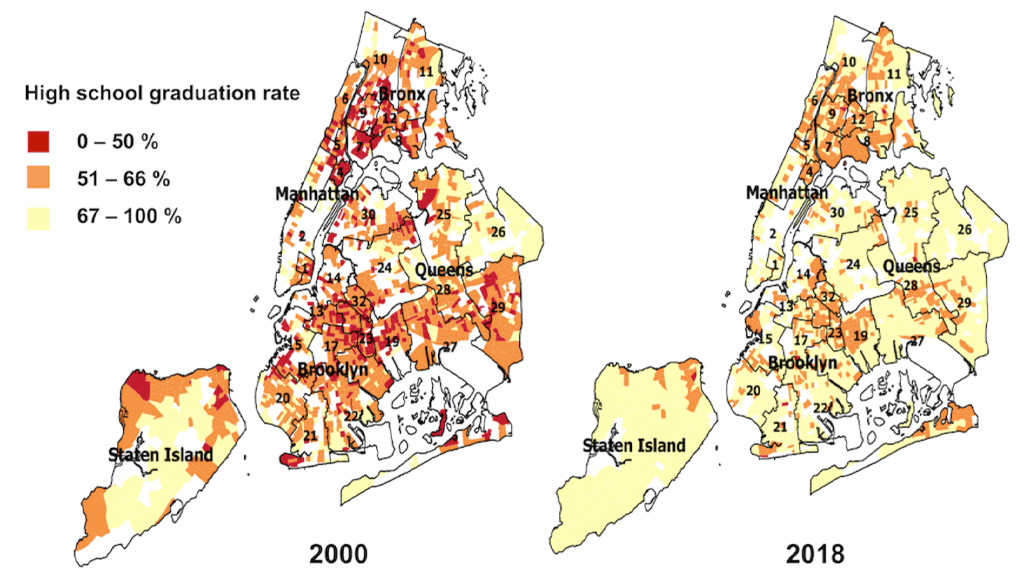
A similar pattern emerges when we examine high school graduation rates. As shown in Figure 3, high school graduation rates improved across the City between 2007 and 2018. In 2007, graduation rates below 50 percent (shown in red) were the norm in many high-poverty tracts. By 2018, graduation rates this low were extremely rare. The proportion of students earning a diploma on time had increased greatly in some of the City’s most vulnerable neighborhoods. Yet, even after these gains, the high-poverty neighborhoods still had lower graduation rates (with most hovering between 51 and 66 percent) than other parts of this City.
Figure 3: High School Graduation Rates, 2007 and 2018, by Residential Census Tract
Additional analyses, not shown here, highlight links between other outcomes and neighborhood income. For example, low rates of proficiency on state exams have consistently been concentrated in the poorest census tracts, even as students’ overall performance has improved. These trends raise important questions for researchers and policymakers working to close gaps for vulnerable students.
Big Questions:
- What strategies have been most responsible for the overall gains in attendance and high school graduation rates in New York City? How can schools ensure that these improvements continue?
- Why have disparities associated with neighborhood poverty proved so hard to address? To what extent are factors outside of school (such as homelessness) to blame for low outcomes? How can educators better support students who are facing these kinds of challenges?
- To what extent are differences in school quality and resources to blame for neighborhood-based disparities? How do racial and socioeconomic segregation shape NYC students’ educational opportunities, experiences, and outcomes? Will current efforts to reduce segregation help produce more equitable outcomes over time?
This post was authored by James Kemple, Chelsea Farley and Kayla Stewart.
This series was published in Spring 2019.
What else should we be asking about the links between neighborhood poverty and education outcomes? Let us know via email.
How to Cite this Spotlight:
Kemple, J., Farley C., and Stewart, K. 2019. "How Have Links Between Neighborhood Poverty and Education Outcomes Changed Over Time?" Spotlight on NYC Schools. Research Alliance for New York City Schools.