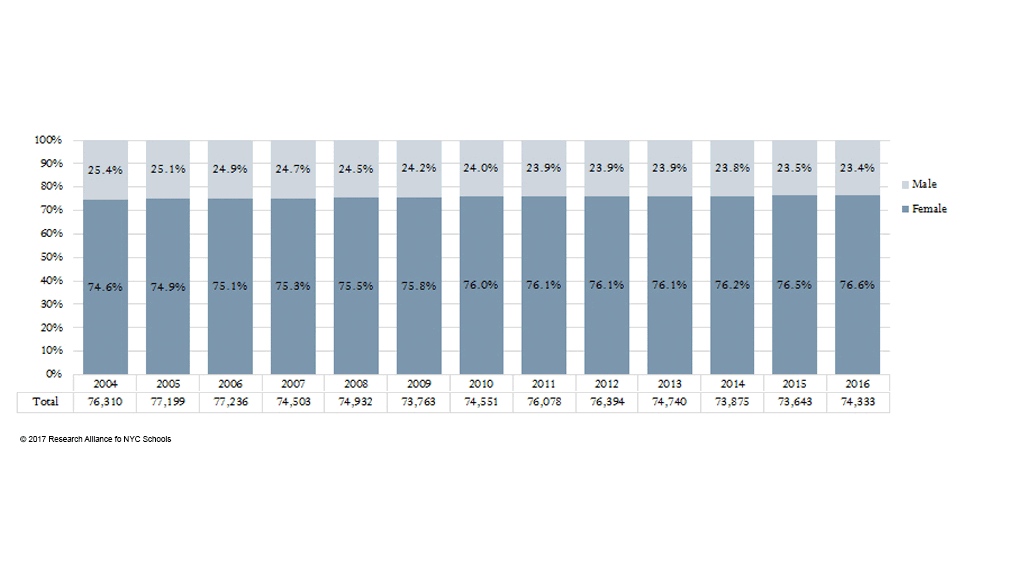
The graph below looks at the gender of NYC teachers, from the 2003-2004 school year through the 2015-2016 school year.[1]
Figure 1: Gender of Teachers in NYC, 2004-2005 through 2015-2016

From 2003-2004 to 2015-2016, the size of NYC’s teacher workforce remained relatively stable, hovering around 75,000. During this time, the proportions of men and women shifted, but only slightly. Women made up 74.6% of the City’s teacher workforce in 2003-2004, growing to 76.6% in 2015-2016. Over the same time, the proportion of men in the teaching workforce fell from 25.4% to 23.4%. This hews very closely to national trends—in 2000, 75% of the nation’s teachers were female, rising to 76% in 2012.
Key Stats
Between the 2003-2004 and 2015-2016 school years:
- The size of the teacher workforce remained relatively stable, with a peak of 77,236 in 2005-2006.
- Men’s share of the teacher workforce declined slightly, from 25.4% in 2003-2004 to 23.4% in 2015-2016.
Big Questions:
These data raise additional questions about the gender breakdown of teachers in the City’s schools:
- Why has teaching remained a predominantly female career? Would having a more gender-balanced teacher workforce make a difference for students’ learning experiences?
- Where are male teachers working? Are they concentrated in specific grade levels, subject areas, or types of schools?
- Does the analysis described above look different for principals? Guidance counselors? Other important school-based staff?
What else should we be asking about NYC’s teacher workforce? Are you exploring any of these topics? Let us know via email.
This post was developed using data provided to the Research Alliance for New York City Schools by the NYC Department of Education. Analyses conducted by Lisa Merrill and David Kang.
Footnotes
[1]The graph includes all full-time and substitute teachers for NYC public schools in October of a given year (including general education and special education). This includes classroom teachers and other employees classified as teachers, e.g., reading coaches, technology specialists, etc. The graph and numbers in the text exclude teachers whose gender was missing from our data.
How to Cite this Spotlight
Merrill, L., Kang, D. 2017. "What is the Gender Breakdown of NYC Teachers?" Spotlight on NYC Schools. Research Alliance for New York City Schools.

