A3SR Student Visualization Competition Runner Up, Kwan Bo Shim
Every couple of months, PRIISM will run a student visualization competition to display and highlight the talents of the A3SR graduate students.
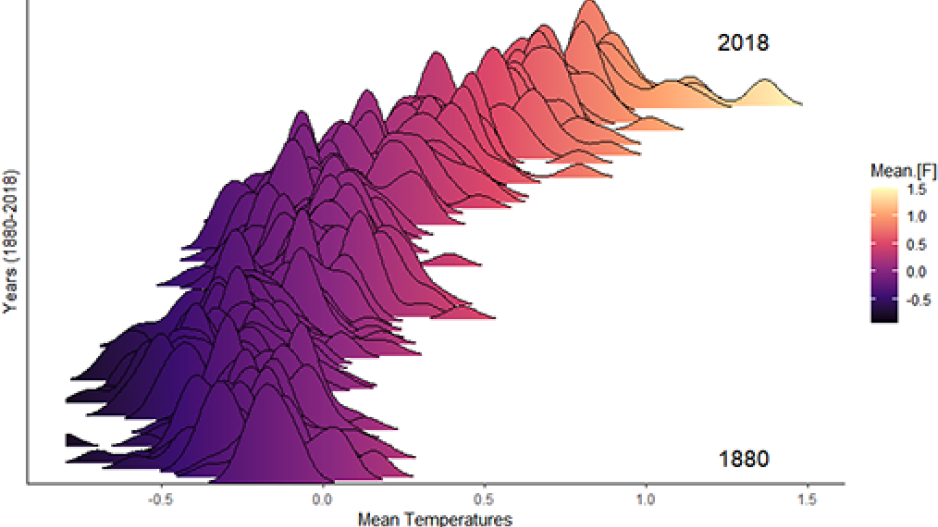
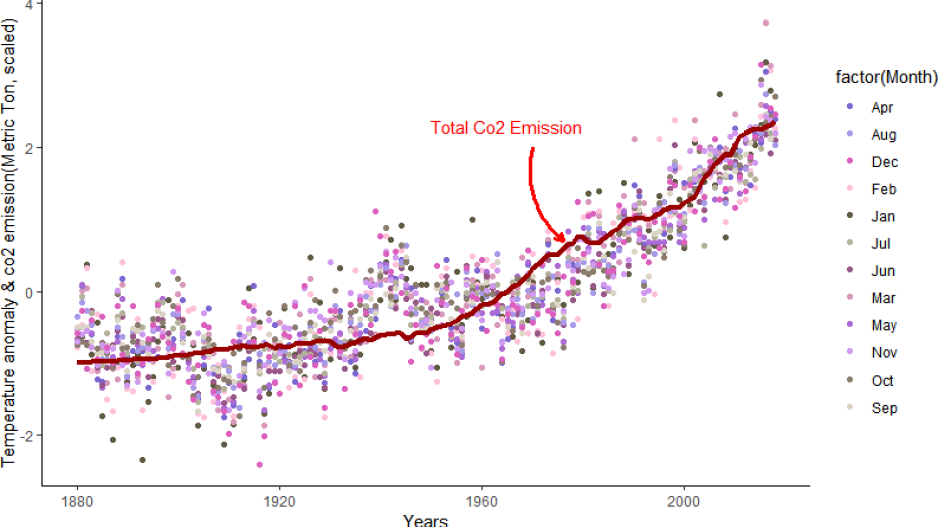
Kwan Bo Shim is the runner up of the first student visualization competition with his two-part visualization titled "World Temperature is Increasing" which intends to emphasize the global warming effect by demonstrating an increasing trend of the global temperature anomaly as well as a constant accumulation of carbon dioxide in the earth over the last century.
Increasing Mean Temperature: Changes in Global Monthly Mean Temperature

Increasing Carbon Dioxide emission and global temperature: Total amount of carbon dioxide emission and monthly temperature anomaly compared to 1950-1980

Source: NOAA National Climate Research Unit

