Executive Summary
Higher Education Context
- Latinx and Black students are not enrolling in and graduating from postsecondary education at the same rates as Asian and White students. Furthermore, BIPOC students are overrepresented in institutions with low graduation rates.
Postsecondary Pipeline
- Important considerations for postsecondary match and fit include: academic alignment for students, how minority-serving institutions have been mischaracterized, and how many BIPOC students live in areas with few college opportunities nearby. Fit criteria that considers student interests and preferences as well and financial aid availability is also essential.
- “Summer melt” — when students who plan to attend college do not enroll in the fall — happens at a higher rate in marginalized communities. Understanding the causes and potential solutions for summer melt among BIPOC and marginalized students is especially important.
- The impact of COVID-19 has disproportionately affected BIPOC and marginalized students.
Policies
- Many national policies exist to tackle educational inequities; however, progress has been stifled by the inability of current policies to explicitly address root problems.
- Looking at federal, state, and district policies can help to understand what may and may not work in other settings. Policies that can provide financial support and guidance to marginalized students can increase students’ postsecondary education goals.
Barriers to Equitable College Access and Readiness
- Several barriers do exist to prevent students of color and other marginalized students from accessing and being ready for college.
- Unique barriers to consider for BIPOC and marginalized student include insufficient student-teacher relationships, cultural stereotypes/racism, lack of financial support and essentializing students.
- Doing so can ensure that practices to pursue college and address these barriers do not utilize a one-size-fits-all approach.
This section summarizes the higher education context for BIPOC and marginalized students. We also explore the postsecondary pipeline of BIPOC and marginalized students, college access and readiness policies, and barriers to equitable college access and readiness.
The Higher Education Context
Examining the college enrollment and graduation trends of BIPOC and marginalized students is one way to better understand existing college access and readiness disparities. National trends indicate that total undergraduate enrollment increased by 37 percent (from 13.2 million to 18.1 million students) between 2000 and 2010, but decreased by 8 percent (from 18.1 million to 16.6 million students) between 2010 and 2018. Total undergraduate enrollment is also projected to increase by 2 percent (from 16.6 million to 17.0 million students) between 2018 and 2029 (NCES, 2019). This means that while undergraduate enrollment was trending upward for almost a decade, more recently it has slightly decreased and increased to a smaller degree. As of 2016, 78% of undergraduates attended public institutions, and 16% attended private nonprofit institutions.
Undergraduate Enrollment Disparities
While a much higher percentage of people in the U.S. have undergraduate degrees, enrollment disparities persist. The percentage of 18-24 year-olds enrolled in college, by race/ethnicity (NCES, 2019) is depicted in Figure 1.
Latinx, Black, and American Indian/Alaska Native students had the lowest rates of undergraduate enrollment. However, between 2000 and 2016, Latinx undergraduate enrollment more than doubled (a 134 percent increase, from 1.4 million to 3.2 million students). In contrast, rates for White, Black, Pacific Islander, and American Indian students increased from 2000-2010, but declined from 2010-2016. It is also important to note disparities within racial/ethnic groups, in order to best customize and prioritize supports. For example, in 2016, the average college enrollment rate among Latinx students with roots in Central America was 33%, compared to the rate among students with South American roots, which was 53% (NCES, 2019). Among Asian students - who are too often overlooked due to the “model minority” myth - 78% of Chinese 18-24 year olds were enrolled in college in 2016, compared to only 23% of Burmese young people and 39% of Hmong young people.
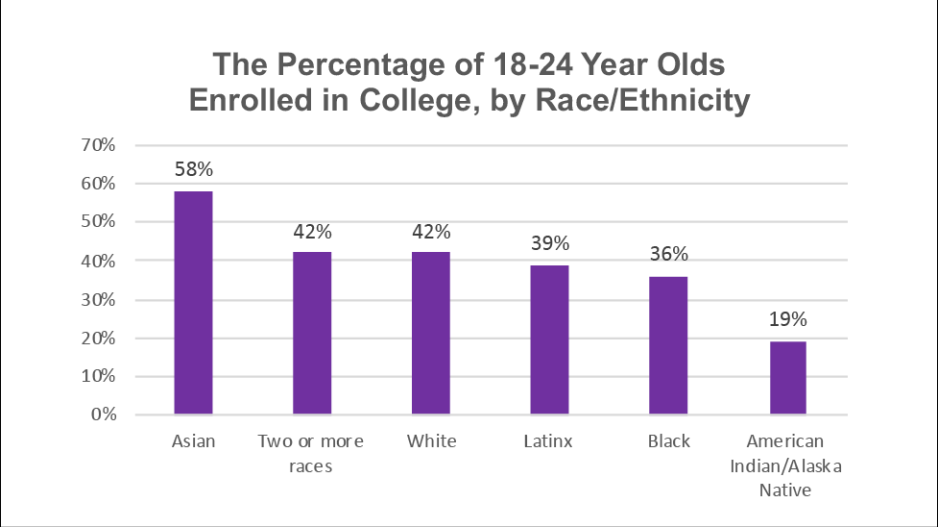
Figure 1. Disparities in college enrollment by race/ethnicity in 2016.
Community College Enrollment and Transfer Trends
It is important to also understand community college trends as many BIPOC and marginalized students enroll in these institutions (Community College Research Center, 2020). Two-year institutions differ from four-year institutions because students need to transfer to complete their bachelor’s degrees. Additionally, fewer than 20% of students who started at community colleges in 2014 completed a degree at a four-year institution within six years. According to the Community College Research Center (2020), of all students who completed a four-year degree in 2015-16, 49% had enrolled at a community college in the previous 10 years. The percentage of undergraduates enrolled at community college, by race, in 2018 academic year is depicted in Figure 2:
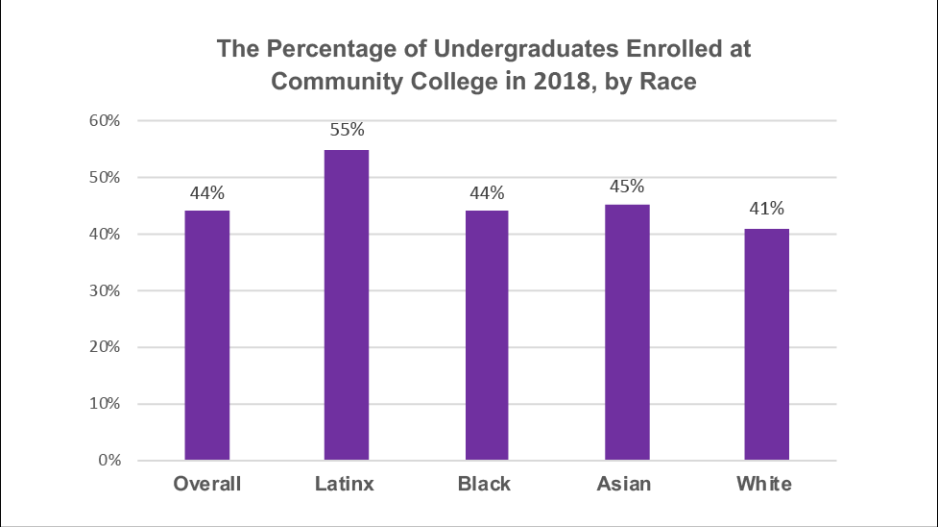
Figure 2. Percentage of undergraduates enrolled at community college, by race
Among Latinx undergraduates, 55% enrolled in community college—the highest percentage of any race.
Income disparities exist for community college students who complete a bachelor’s degree. The National Student Clearinghouse (2017) shows that the rates of students earning bachelor’s degrees who begin at community college varied by income. While the overall completion rate was 13%, for lower-income students, 9% earned bachelor’s within 6 years, compared to higher-income students, among whom 20% earned bachelors within 6 years.
The rates of students who earn bachelor’s degrees who transferred out of community college and into a 4-year institution also varied by income. For lower-income transfers, 35% earn a bachelor’s degree, while for higher-income transfers, 49% earn a bachelor’s degree. When students transfer, they fare best in public institutions; 31% who transfer to private nonprofit institutions earn bachelors, and 41% who transfer to public institutions earn bachelor’s (National Student Clearinghouse, 2017).
Public four-year schools are more likely to have an articulation agreement with community colleges, which enables students to transfer more credits. Students also fare better in 4-year institutions that serve higher-SES students and are more selective: 27% of transfers into lower-SES institutions earned a degree, 43% of transfers into higher-SES institutions earned a degree, 55% of transfers into very selective schools earned a degree, and 21% of transfers into nonselective schools earned a degree. Black students are not less likely than White students to enroll in a two-year school, yet they are less likely to use it as a stepping stone to a four-year school (Boylan, 2020).
College Retention Racial/Ethnic Disparities After First Year of College
Accounting for all races, first-year persistence rates barely changed in recent years, from 2015 to 2018 (National Student Clearinghouse, 2020). Of the 2.6 million students who enrolled in college as a first-time undergraduate students in fall 2018, 76 percent persisted at any U.S. institution by fall 2019. An average of 9 percent of freshmen, in any fall term between 2009 and 2018, transferred to a different institution by the following fall. First-year persistence rates by race are depicted in Figure 3.
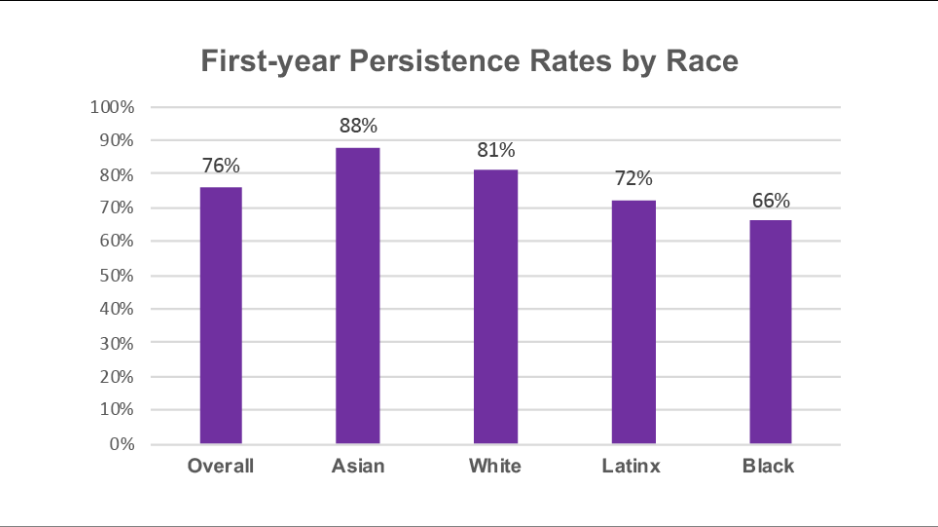
Figure 3. First-year persistence rates, by race. The percentages were only reported for these racial/ethnic groups.
First year persistence rates varied by the type of postsecondary institution. First-year persistence rates were higher for students in public 4-year institutions, and the racial gaps were smaller, compared to 2-year institutions. The first-year persistence rates were much lower for students in 2-year colleges. The persistence gap was highest between Asian and Black students. First-year persistence rates were highest in private nonprofit 4-year institutions, although not considerably different than in 4-year public institutions, and gaps were similar as well. The differences in persistence are depicted in Figure 4.
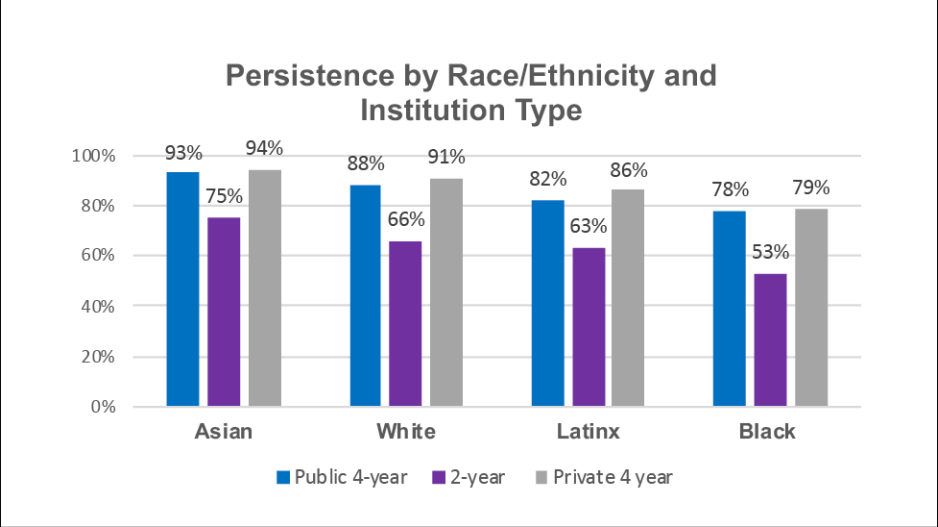
Figure 4. Persistence by race/ethnicity and institution type. The percentages were only reported for these racial/ethnic groups.
Racial/Ethnic College Completion Disparities
In 2020, the national six-year completion rate appears to have reached a plateau, showing the smallest increase of the last five years, a 0.3 percentage point growth to 60.1 percent (National Student Clearinghouse, 2020). The national completion rate has stalled largely because traditional age students and community college starters have lost ground. The six-year completion rate of community college starters declined for Latinx and Black students, despite previous growth. Only Asian students made gains, whose rate improved by 1.3 percentage points. Black students who started at public four-year institutions made stronger gains than White students.
Completion rates also varied by the percentage of low-income and minority population in the high schools students attend . For students from low-poverty high schools, 60% earned a degree 6 years after high school. In comparison, 23% of students from high-poverty high schools earned a degree 6 years after high school. For students from low-minority high schools, 53% earned a degree 6 years after high school. A lower percentage of students from high-minority high school (31%) earned a degree 6 years after high school.
The overall college completion rates by race/ethnicity in the U.S. are depicted in Figure 5 for public 4-year institutions and for public 2-year institutions (National Student Clearinghouse, 2020).
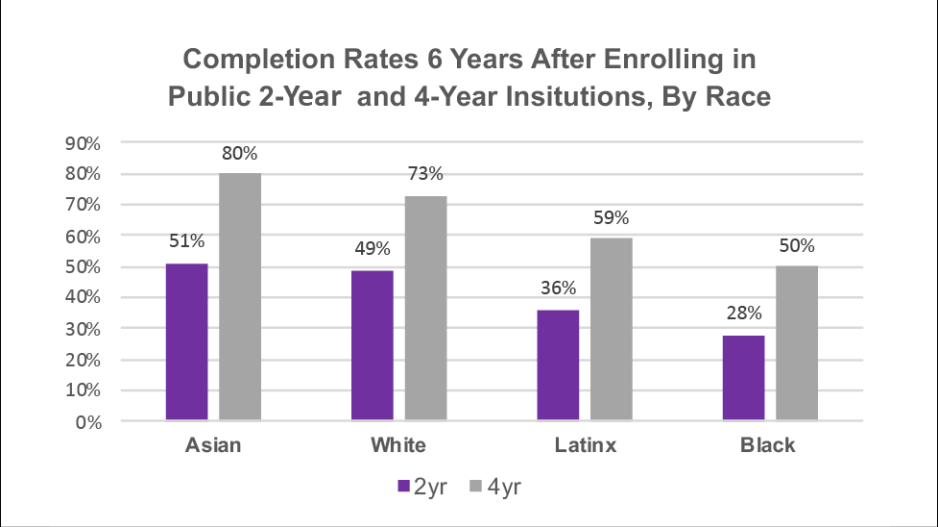
Figure 5. Completion rates (at any institution) 6 years after enrolling in public 2-year and 4-year institutions, by race. The percentages were only reported for these racial/ethnic groups.
Completion rates vary drastically depending on institution type, with students attending 2-year institutions faring the worst. The National Student Clearinghouse (2020) examined fulltime and part-time undergraduate enrollment and found that students fare much better when attending full-time: For students enrolling full-time in 2014, 27% left college without earning a credential, compared to 54% among part-time students. This disparity can be attributed to part-time enrollment in community college, versus a 4-year college.
Note also that the 6-year graduation rate was higher for females than for males overall (63 vs. 57 percent) and within each racial/ ethnic group. The gender gap was narrowest among Pacific Islander students (53 percent for females vs. 50 percent for males) and widest among Black students (44 percent for females vs. 34 percent for males) (NCES, 2019).
In Summary
Latinx and Black students are not enrolling in and graduating from postsecondary education at the same rates as the Asian and White populations. Furthermore, BIPOC students are overrepresented in institutions with low graduation rates. As such, this literature view focuses on supporting college access and college readiness for BIPOC students.
Postsecondary Pipeline
We describe the postsecondary pipeline as including college match and fit, summer melt, and implications of COVID-19 on college enrollment. We approach these issues as potential ruptures in the postsecondary pipeline for BIPOC and marginalized youth and present considerations to prevent these ruptures.
Postsecondary Match, Fit, and College Completion.
A “match” is when a student’s academic credentials, premised on grades and test scores, align with the selectivity of the college or university in which they enroll. A “fit” refers to how well a student meshes socially and academically once on campus. Students are more likely to graduate when they attend the most selective institution that will admit them (Bowen, Chingos, & McPherson, 2009), as less selective institutions tend to have less financial aid and offer fewer academic and social supports (Bowen, Chingos, & McPherson, 2009).
The degree to which students undermatch (i.e. attend a less selective college or university than they could) or overmatch (i.e. attend a more selective college or university than their credentials would indicate) is tied to high school and neighborhood contexts. For example, when examining the high school context, a standard deviation increase in the share of high school graduates admitted to a 4-year college raises the probability that a student overmatches by 3.6 percentage points and lowers the likelihood that the student undermatches by 3.0 percentage points (Dillon & Smith, 2017). Students with college-educated parents and who live in census tracts with more college graduates overmatch more and undermatch less. The effect of the census tract is particularly strong. A standard deviation increase in the share of adults with a 4-year college degree increases the probability of overmatch by 4.0 percentage points and decreases the probability of undermatch by 2.4 percentage points. (Dillon & Smith, 2016). Attending high schools that are sending more students to college and living in neighborhoods with a higher number of college educated adults have clear implications for college match. BIPOC and marginalized students may not be attending high schools or neighborhoods such as these because of existing racial and social inequalities.
Other Considerations for Match and Fit.
Postsecondary matches for BIPOC and marginalized students call for a more nuanced discussion beyond academics and test scores. When considering college fit, it is important to consider other factors of the institutions matched
with students beyond selectivity. One factor to consider is the racism that exists in higher education. When examining college quality, criteria may favor predominantly White institutions, rather than those serving BIPOC students. For example, one manner through which colleges can be classified includes college rankings. Richards et al. (2018) used a CRT lens to analyze how two out of three popular college ranking systems’ median rankings for minority-serving institutions (MSIs),were lower than that of non-minority serving institutions. This difference points to the racialized definitions of “higher ranked” colleges. Furthermore, college rankings do not account for historical injustices, differences in resources, nor do they provide objective ranking methodologies (Richards et al., 2018). Since the rankings may describe these MSIs as lower ranked, they may indicate to BIPOC students to apply elsewhere when they may find a best fit at an MSI. Flores and Park (2015) add further evidence to the quality of MSIs. They found that in Texas, non-MSI graduation rates were comparable to non-MSIs graduation rates when accounting for student differences.
The Partnership for Los Angeles Schools (2021) recently released a publication connecting “best fit” college advising to success for students of color. The four criteria that the Partnership uses includes student interests and preferences, likelihood of admission, likelihood to graduate close to on time, and financial aid available for tuition and living expenses without having to take out substantial loans. This description of fit adds an important financial component as loans can be a concern for BIPOC students who cannot afford to pay for college. It also emphasizes the importance of students’ interests and preferences because although items such as “selectivity” matter in match, students must also feel that the higher education institution will meet their personal needs that go beyond academics.
Geography of Opportunity and Match.
Research on the “geography of opportunity” in higher education illustrates that where students live shape their college decisions (Hillman, 2016). Students with a closely matched in-state public college within 50 miles have lower probabilities of both overmatch and undermatch. In-state tuition policies often make attending a home state college affordable compared to out-of-state colleges. Furthermore, attending college locally provides students other cost saving options such as lower travel expenses and the option to live at home (Dillon & Smith, 2016). Dache-Gerbino (2018) found concentrations of Black and Latinx students in “college deserts,” where there were limited local postsecondary institutions. Another national study found that low-income and first-generation college students were also more likely to live in college access deserts (Klasik et al, 2018). If low-income students prefer to stay closer to home but are in college deserts, this complicates the college match (Ovink et al., 2018). Aiming to connect BIPOC and other marginalized students to selective colleges is important. Still, similar to the interrogation of college rankings, it is vital to not solely focus on selectivity as the best fit for BIPOC and marginalized students. Other considerations such as racial climate, academic and social supports, location, and financial aid can also play important factors when deciding on colleges.
Impact of Summer Melt for Low-income Students.
Summer melt describes the loss of qualified high school graduates from the path to college in the period between high school and college (Rall, 2016). Summer melt, nationally, among low-income students is anywhere between 8-40% (Castleman & Page, 2014) (it’s challenging to have a precise number because of the difficulty of collecting reliable data on this). The rates of summer melt are higher among:
-
Students from low- and moderate-income families
-
Students with lower academic achievement
-
Students who intend to enroll at community colleges
-
Students from high schools with greater proportions of students qualifying for free-reduced price lunch
Causes of Summer Melt with BIPOC and low-income students.
A study analyzing graduates from charter high schools also found that Black and Latinx students were twice as likely as their Asian counterparts to change their college plans over the summer (Gonzalez & Thal, 2020). One of the significant causes of summer melt is that students may need to secure additional funds to cover gaps between the cost of attendance and the financial aid package they received. Students also need to complete a range of paperwork for their intended institution: course registration, housing forms, and academic placement tests (Castleman & Page, 2014). A case study at a predominantly low-income Black and Latinx high school in Los Angeles found that for ten summer melters the reasons given for them not starting college included financial struggles, failure to meet requirements, inability to obtain the classes wanted/needed, inadequate support, and unclear communication (Rall, 2016). A larger mixed-methods study with a high percentage of low-income students who were college-bound seniors found similar concerns about not having a college-bound identity, financial and life concerns, lack of academic preparation, and considering other career options (Ober et al., 2020). This study also suggests the importance of social interactions with counselors using text messaging applications during the summer before the start of college.
Impact of COVID-19 on College Enrollment.
High poverty and high minority schools experienced the highest college enrollment declines during COVID-19. According to the National Student Clearinghouse (2021), college enrollment declined in fall 2020, and more
so among students from high-poverty and high-minority high schools. Community college enrollment declined the most. While COVID-19 has not impacted high school graduation in the school year 2019-2020, fewer graduates went to college immediately after high school in fall 2020, declining by 7% compared to 2019 graduates. In high-poverty high schools, immediate college enrollment rates dropped by 11%, compared to 3% in low-poverty high schools. In high-minority high schools, the college enrollment rate declined by 9%, compared to 5% in low-minority high schools (National Student Clearinghouse, 2021). The declines were also larger in urban and rural high schools, compared to suburban ones. In terms of immediate enrollment, community college enrollments dropped by 13%, while public four-year college enrollment only dropped by 3% (National Student Clearinghouse, 2021).
In Summary
- Important considerations for postsecondary match and fit include: academic alignment for students, how minority-serving institutions have been mischaracterized, and the geography of college opportunities. Fit criteria that considers student interests and preferences as well and financial aid availability is also essential.
- Summer melt happens at a higher rate in marginalized communities. Understanding the causes and potential solutions for summer melt among BIPOC and marginalized students is especially important.
- The impact of COVID-19 has disproportionately affected BIPOC and marginalized students.
Policies that Influence College Access and Readiness
Many college access and readiness policies currently exist to address educational inequities, though many have their own challenges. Of note, many policies are not explicit about equity and fail to amplify how they affect BIPOC and marginalized populations. Without this specificity, implementation at the federal, state, and local level may miss ways to better serve these populations. Below, we provide a list of policies at the federal, state, and district level.
College For All
With an eye towards equity to combat the underrepresentation of students in higher education, district-wide policy approaches to “College for All” aim to ensure that all students have access to college preparatory curriculum and are prepared to enroll and succeed in college. As scholars further unpack the “College for All” movement, they posit that there needs to be a greater focus on justice and democracy rather than solely focusing on students’ postsecondary paths (Kolluri & Tierney, 2018). Kolluri and Tierney (2018) call for “Justice for All” where students are prepared for civic engagement by developing skills such as critical consciousness. Quartz et al. (2019) documented how a district-wide “College for All” policy was implemented at one school site. Suggestions to deepen “College for All” policy implementation include making certain students at schools are not prevented from participation in college because of factors such as resources, opportunities, social esteem and respect. Quartz et al. (2019) also emphasized the importance of creating academic support for students to meet higher standards and the financial supports needed for college. Lastly, a consideration is that the public own what it takes to implement this type of school reform, including resources, supports, and follow-through to make “College for All” possible (Quartz et al., 2019). Like the “College for All” movement, approaches to equity at the intersections of college access and college readiness must also be expanded by using critical approaches. Too often college preparatory programs and research that seek to improve college readiness and access for vulnerable populations tend to take a deficit approach, primarily attributing the lack of readiness and access to student performance rather than examining the sociocultural context in which low-income and BIPOC youth must navigate. Taking a deficit approach constricts our view of the many systemic and sociocultural factors that impact BIPOC journeys to higher education.
Affirmative Action
Affirmative action in education takes a proactive approach toward ensuring diversity in the university setting. It treats characteristics such as race as a “plus factor” in decision making for admissions and scholarship opportunities. Generally, psychological and educational researchers note the importance of affirmative action in education: (1) It ensures diversity of student bodies, and (2) It ensures that selection procedures and decisions are fair (because students of color are already at a disadvantage with having to apply to universities that were founded in Whiteness. As such, their policies, practices, and wants in applicants disadvantage students of color). Many people in the general public are opposed to affirmative action based on their own notions of the policy. However, people tend to favor “soft” forms of affirmative action like outreach programs over “hard” forms such as making race the tiebreaker in hiring decisions (Crosby et al., 2006). Allen et al. (2018) focused a 40 year analysis of educational trends and on legal cases that constrained opportunities in higher education for Black students. Black students had less representation at flagship universities and were more likely to attend and graduate from Black-serving institutions. Vue et al. (2017) interviewed Black and Latinx alumni from two race conscious high school intervention programs to better examine their understandings of affirmative action. Alumni counterstories discussed themes such as hostile discourses, contextualizing affirmative action, the confluence of race and class, and
endgame.
Every Student Succeeds Act
The Every Student Succeed Act (ESSA) serves as the current federal education law. It takes a more comprehensive approach to determining school performance, compared to its predecessor, No Child Left Behind. While standardized test scores are important, ESSA also examines factors like attendance and school climate, and access to advanced placement courses in determining schools’ performance. It eases restrictions from No Child Left Behind and provides more power to states; however, principals are still required to send accountability plans, which need to address topics like English Language Learners (ELL) and graduation rates. Many pros and cons have been identified by the general public and researchers for ESSA:
-
Pros: (1) The added attention to ELL. (2) With the power given to states, local school districts are now able to implement practices and methods that best fit their individual needs. This is critical as maintaining ELL classification during transitional school times can negatively impact high school graduation and attendance to a four-
year university (Johnson, 2019). -
Cons: (1) Less parental notification—School districts are not required to notify parents if their child is attending a low-performing school and they do not have to prove that teachers are highly qualified in order to receive Title I funding. Based on this, it seems as though states have the opportunity to develop assessments and other practices with little oversight on how funding is spent. (2) Importantly, ESSA does not adequately address the connection between property taxes and school status (e.g., access to resources, opportunities, and qualified teachers); thus, it cannot make a significant effort to provide social justice in education.
The degree to which ESSA integrated College and Career Readiness (CCR) frameworks varies greatly by state. Some states do not address CCR standards or do so with little emphasis (Hackmann et al., 2019). Furthermore, most state plans do not address ESSA CCR aims with specific racial and ethnic groups. Because states have the power to implement different strategies and initiatives to fit their needs, it is important to examine such practices and discussions in order to determine whether they can be implemented in other places.
Delaware Initiative
School counselors play an important role in supporting students’ educational journey. The American School Counseling Association recommends that there should be a 1:250 school counselor-to-student ratio in order for school counselors to be effective in their practices; however, in Delaware, the numbers were significantly above this ratio (in the 2013-2014 school year (Clinedinst et al., 2015). School counselors tend to spend less time talking with students about postsecondary options in low-income schools (Danos, 2017). This, in combination with insufficient school counselor-to-student ratios, reduce the likelihood that low-income students receive information about college. One potential option is for the Delaware General Assembly to mandate that each school should have enough school counselors to meet the recommended ratio (Danos, 2017). Another option could be to increase professional development funding for current guidance counselors in order to share the workload of college-related topics with school counselors. Finally, and potentially the most feasible, another option could be to increase school-community partnerships to supplement college counseling services in Delaware public schools (Danos, 2017). Such a policy could look like appropriating funds to universities and community-based organizations to implement pilot studies on school-community partnerships.
Florida Initiatives
Researchers in Florida (Iatarola, 2016) have called for the increase of advanced course offerings in high school. Taking at least one advanced course is associated with increased standardized test scores and 4-year college enrollment with those who take courses within the first two years of high school receiving the most increases. Florida currently has several initiatives to offer incentives for taking AP courses and passing related exams. For example, the Florida College and Career Readiness Initiative makes college placement testing mandatory for 11th grade students who score within a “college-ready” range on standardized 10th-grade assessments. Students identified as college ready were also provided college readiness courses. However, research notes that this policy has not had a significant impact on long-term college success (Mokher & Leeds, 2019). Such reasons include the notion of theory of action. Specifically, while stakeholders believed that notifying students of their academic status would motivate them to improve upon their skills, it could have had the opposite effect and actually discouraged them. This is especially true for marginalized students who require culturally responsive practices that are often not included in classrooms.
Many holes have been discovered in policy work that is meant to serve marginalized students. For example, Rodriguez (2018) found that high schools in the U.S. that serve predominantly low-income students of color do not align their curricula for graduation requirements with college admission requirements. Such misalignment included certain mathematics classes not being required in high school that would be required for their corresponding flagship university’s admission. Perna et al., (2015) also found that when curriculum focused on college preparation, such as the International Baccalaureate program, is available, Black, Latinx, and low-income students are under-represented. As such, high school course offerings should align with the requirements of the flagship university’s admissions requirements. Additionally, providing alternative courses, such as dual enrollment or advanced online coursework, can advantage students while ensuring that under-resourced schools are not having to bear the burden of teaching more classes. It is important to note that Rodriguez (2018) found differences between low-income schools serving White students versus low-income schools serving Black and Latinx students, further warranting the need to target higher education supports for students of color. In addition to misalignment in school policies, limited research exists to examine policy outcomes related to college readiness for students with disabilities, Asian, and Indigenous students, warranting the need for the creation of policies that can provide equitable college access and readiness opportunities for these particular populations.
California Initiatives
Traditionally, undocumented students have found it difficult to receive financial aid in order to obtain higher education. This is especially true for state-funded financial aid. Adopted in 2013, the California Development, Relief, and Education for Alien Minors Act (CA-DREAM) provides undocumented students with aid in order to support their goals of postsecondary education. In particular, CA-DREAM provides fee waivers for per-unit enrollment fees at the community college level, which equates to approximately $550 per semester. When evaluating this policy, Ngo and Astudillo (2019) found promising results, including academic engagement among undocumented Latinx male students. Additionally, receiving CA-DREAM aid resulted in higher academic attainment and persistence, suggesting the use of policy initiatives that can financially support undocumented students.
In Summary
- Many national policies exist to address educational inequities; however, progress has been stifled by the inability of current policies to explicitly address root problems.
- Looking at state and district policies can help to understand what could work in other settings. Policies that can provide financial support and guidance to marginalized students have the potential to increase students’ postsecondary education goals.
Barriers to Equitable College Access and Readiness
We conclude this section by presenting barriers to college access and readiness, among BIPOC and marginalized youth. Generally, marginalized communities have the added battle of succeeding within a system that was not designed to help them do so. Examining the intersection between race, class, and sociocultural contexts, we know that there is a longstanding history of struggles for Black and Latinx individuals. With oppressive practices like redlining (i.e. not offering housing loans to people of color), ethnic minority individuals are forced to stay in under-resourced neighborhoods. These under-resourced neighborhoods produce under-resourced schools due to the small property tax that is received from such houses. Characteristics of these inferior schools include lack of educational resources, lack of educational opportunities, inexperienced teachers and lack of support, and overall poor academic experiences for children of color (Burke & Schwalbach, 2021). These characteristics, as well as others, can lead to decreased college access, readiness and eligibility.
Insufficient Student-Staff Relationships.
Many diverse schools employ educators who are racially different from their students. For example, Yeager and colleagues (2017) found that the majority of teachers in many diverse schools are White, creating a barrier to relationship building. When student-teacher relationships are not positive, teachers are less likely to inspire students to obtain higher education goals (Yeager et al., 2017; Davidson et al., 2020). Outside of the classroom, barriers to college readiness can form when students do not have access to school guidance counselors. School counselors are critical in providing students with college planning guidance (Hines, 2017); however, many low-income students attend schools with insufficient access to counselors (Comeaux et al., 2020), further decreasing their ability to become college ready.
Cultural Stereotypes/Racism.
Students of color often experience cultural stereotypes, a form of deficit thinking based on a person’s race/ethnicity or gender, which can affect their ability to receive adequate educational opportunities that prepare them for higher education. When educators utilize cultural stereotypes, they tend to focus on individual situations versus examining the structural inequities that shape those individual situations (Weber et al., 2018). Cultural stereotypes result in educators not challenging students to think critically and do higher-level work, diminishing their chances of being successful in postsecondary education (Kiyama, 2018). Black college students identified challenges they faced as not feeling academically prepared for college and not enough academic support services offered to help them as well as experiencing racism inside their classrooms and at the university campus (Harper et al., 2018). Meanwhile, high achieving Black students in another study chose not to enroll in University of California public campuses because they were denied entry into the most selective institutions, needed financial support, and became aware of racial climate issues at some UC college campuses (Comeaux et al., 2020).
|
Cultural Stereotype Example |
|||
|
Cultural Stereotype |
The Situation |
The Action |
The Result |
|
Black girls are troublemakers. |
Black girl refuses to do her work because it is too hard. |
Teacher allows her to do what she wants in order to avoid trouble. |
The Black girl is not challenged in performing the work. |
|
A common cultural stereotype is that Black girls are troublemakers. In a classroom, this is never said aloud; however, practices can inherently provide this message. In this example, the student is refusing to do her work because she believes it is too hard. The teacher allowing her to not try in order to avoid escalating the students’ negative behaviors simultaneously means that the student is not being challenged. It sends a reinforcing message to that student that she is not capable, shaping her view that she is not capable of challenging work at the postsecondary level. Additionally, the teacher may believe (s)he has good intentions by allowing the student to not have to do the work. They could believe that this helps build the student-teacher relationship; however, this is a costly practice that further diminishes the students’ belief that she can be a good student. |
|||
Lack of Financial Support.
With the price of college continuously increasing (Baum, 2018), attending a postsecondary institution is a significant challenge. Lack of financial support can lead students to be ill-prepared for college applications. Despite having unequal access to appropriate educational resources, low-income students are still faced with taking the same college-entry standardized tests as their same-aged (but well-off) peers. This unequal access to educational resources leads to those low-income, and oftentimes racially marginalized, students to score much lower than their White, middle-class peers (Davidson et al., 2020). Furthermore, those marginalized students do not have enough funding to be able to retake those standardized tests, lessening their chances of receiving entry to higher education (Davidson et al., 2020). In addition to financial barriers for testing, many marginalized youth worry about financial aid and often have to navigate the process on their own due to their family not having insight about the college process and not have access to resources within the school system (e.g., guidance counselor) that can help them to fill out Free Application for Federal Student Aid (FAFSA) applications and scholarships.
Once students are able to overcome the hurdle of finances for applying to college, another battle begins as they often struggle to pay for college going forward. With deep cuts in state funding over the past decade, paying for college has become more of a burden for students, especially those of color and from low-income backgrounds who were already struggling (Mitchell et al., 2019). Funding cuts have resulted in a number of barriers to students of color. This includes reduced academic opportunities and student services (Mitchell et al., 2019), which have helped students of color to navigate the novel world of college. For example, critics of the TRIO Program, which aims to help first-generation college students navigate the university setting, have proposed budget cuts to the program, which would ultimately affect students of color and low-income students’ access to support. Additionally, because Black and Latinx students are statistically more likely to be low-income due to historical and racial trauma, they are more likely to borrow loans to pay for post-secondary education (Havens, 2021). Subsequent racial and gender wage gaps disadvantage these individuals by making it hard for them to repay their loans (Havens, 2021).
Essentializing Students. Essentializing can be understood as the process of classifying multiple ethnic groups under one social category (e.g., Latinx) and assuming that all members of that social category have the same experiences. Essentializing racial groups can prevent an understanding of how BIPOC students’ multiple identities and experiences influence their educational trajectories. Ayala and Ramirez (2020) studied Latinx college student experiences and discussed how essentializing BIPOC students minimizes differences in their experiences and ignores their multi-dimensionality.
While it is important to consider race/ethnicity, ignoring other identities that students have presents an additional barrier to college access and readiness. Acevedo-Gil (2019) found that while teachers offered college-information to their Latinx students, the teachers failed to engage in discussions regarding this information. Without the discussion, students were unable to share their perspectives from their multiple identities as they processed the college information. While teachers were doing their best to serve Latinx students, by not offering space to for students to talk about the college information through the lens of their multiple identities this type of college information was essentialized. Acevedo-Gil (2019) discussed how Latinx high school and post-high school students using a lens that considers their intersectional identities (“la facultad”), including immigrant status, socioeconomic status, first-generation college identity, and previous academic achievement, led them to anticipate postsecondary obstacles when accessing college information, including financial cost, academic preparation, and navigating higher education for the first time. For example, those from a lower socioeconomic status will find that they need to look for and apply for
scholarship and grant opportunities. Those with a first-generation college identity may have trouble navigating a novel setting. Intersectionally, a first-generation college student from a lower-income background, may find it hard to find and navigate scholarship and grant applications.
In Summary
- Several barriers do exist to prevent students of color and other marginalized students from accessing and being ready for college.
- Unique barriers to consider for BIPOC and marginalized student include insufficient student-teacher relationships, cultural stereotypes/racism, lack of financial support and essentializing students.
- Doing so can ensure that practices to pursue college and address these barriers do not utilize a one-size-fits-all approach.


