

The next step in the process was the youth participatory action research (YPAR) project to deepen an understanding of disproportionality and its outcomes in the student’s own local school contexts. The political education and curriculum outlined in Unit 4 was a necessary step before taking on the YPAR project because it helped set the context for the project by deepening knowledge on disproportionality. After extensive political education and deep discussions, the YPAR project gave us the space and opportunity to further understand the lived experience of how students were impacted by disproportionality in their everyday realities.
Why Youth Participatory Action Research?
Given that youth are impacted by disproportionality, it only seemed logical that the youth not just take part in the process of addressing the issue, but are the ones taking a key leadership role. It is youth that bring the knowledge and expertise of their lived experiences in order to help adults create more equitable school environments. Thus, we adopted a Youth Participatory Action Research (YPAR) framework. YPAR is an epistemology that engages collective action of a group where academics and participants democratically engage in research design, methods, and analyses (Torre, 2009). PAR includes those who have been most systematically excluded, oppressed, or denied, despite carrying wisdom about the history, structure, consequences, and fracture points in unjust social arrangements (Cammarota & Fine, 2008). Furthermore, the knowledge generated from PAR is culturally relevant and connected to people’s lived experiences and arguably sparks action more than knowledge that is generated from academic theory or from outsider perspectives (Jacquez et al., 2012).
PAR is rooted in Freire’s critical praxis and stems from the principles of critical pedagogy of examining power and positionality. In YPAR, students take the lead in their own liberation and interrogate their positionality within dominant structures. Cammarota & Fine (2008) note in utilizing YPAR, “education is something students do--instead of being done to them--to address the injustices that limit possibilities for them, their families, and communities” (p. 10). Given that our education largely excludes youth from the decision-making process despite their knowledge of their own needs, PAR has the potential to radically transform schooling in advancing equity.
Tuck & Guishard (2013) hold that, “participatory research holds revolutionary possibilities for restructuring relationships between academic scientists and communities. PAR projects have been successful in enhancing academic and lay understandings of social theory and practical problems” (Tuck & Guishard, 2013, p15). Addressing disproportionality and the oppressive structures that birthed these inequitable outcomes cannot be properly addressed without participation from those who are most disenfranchised- our Black, Brown, and vulnerable youth.
Executing a YPAR Project
There is no magic formula in executing a perfect YPAR project. It is often a messy, organic process. PAR is conducted in many different ways. Ultimately, the project will bend to and reflect a group’s particular context and capacity. In this section, we outline suggestions of the typical steps of a YPAR project, and what worked for us. Typically, a PAR project includes the following steps:
- Political education
- Identify the problem
- Preliminary data collection (learning about the context of local settings)
- Quantitative data collection
- Qualitative (observation) data collection
- Pose a question
- Identify what tools are needed to answer the question
- Data collection
- Collective analysis of the data
- Draw conclusions (Findings)
Before getting started, it’s helpful to have an outline of what your goals are. Review appendix C for a sample timeline. Keep in mind that deadlines and goals may be adjusted accordingly.
- Political education
Before engaging in empirical research, one must first grasp a wide understanding of the context that shapes the problem. That process, political education, is described in Unit 3.
- Identify the problem
After ongoing political education, we were aware that the issue we wanted to tackle was disproportionality. As discussed in the previous section, we extensively interrogated disproportionality and its root causes and implications. Thus, YTAC-D members had a good sense of the problem (disproportionality) and were ready to collect preliminary data to gain a deeper knowledge about the context of their own schools.
- Preliminary data collection (learning about the context of local settings)
Early in the research process, YTAC-D engaged in capturing the context of the NYCDOE educational landscape. As you can see from the timeline (appendix C), we spent the first three month gathering contextual data to give us more information about the culture of our schools. In this process we looked at (a) quantitative data and (b) collected qualitative (observation) data.
3a. Quantitative Data Collection
We wanted to understand the social context and “hard data” or numbers of students who were suspended, disaggregated by race and other identifying factors. For us to further our knowledge on disproportionality, we reviewed quantitative achievement and behavioral data, disaggregated by race. We looked at National Public School Achievement, the NAEP, for reading and math in the fourth and eighth grade. Furthermore, we reviewed state data controlling for poverty. For this data analysis, we conducted a gallery walk, reviewing the data as visual charts and graphs and taped them around the room. During the gallery walk we wrote comments on sticky notes about what surprised us or stood out to us about the data. In another session we looked at NYC DOE district behavioral data. The students broke into groups and got to review data from the district that their respective school was a part of. In order to review that data, students learned about interpreting the risk index and relative risk ratio. Risk index identifies at what rate, or percentage of risk, students of a particular racial/ethnic group have in a particular outcome. Relative risk ratio are comparisons of the risks of a particular outcome of one group to the risk of the remaining group(s) experiencing the same outcome. This is the same process that the adults engaged in the TAC-D root cause sessions.
Reviewing and analyzing the quantitative data was not as challenging as the adult facilitators anticipated for the students, for they talked with ease about trends they found in the data. The youth even brought up limitations of the data, asking questions such as “what about Muslim students? Or refugees? Or LGBTQ+ students? Or Black students who are Latinx and vice versa?” Students quickly humanized the data and began to relate it to what they observed in their own schools.
Below are tools that helped us collect and analyze quantitative data (respectively) from their school contexts:
- Quantitative Data Collection Tool (Appendix F) This tool allowed us to collect data that would paint an overall picture of the school disaggregated by race/ethnicity, gender, sexuality, and students with an IEP[1] reflected in the students and school adults as well as achievement data, discipline data and surrounding community demographics
- Analysis of Quantitative Data: Data Gallery Walk and Discussion (Appendix G) This activity helped us collectively analyze the quantitative data we collected from the “quantitative data collection tool.” By participating in the gallery walk, we got a wide look of the data from various schools and were able to process and draw conclusions individually, in small groups and and as a whole.
3b. Qualitative (observation) data collection
To complement our quantitative data collection, YTAC-D participants set out to explore the following question- “What policies and practices are implemented at your school that reinforces disproportionality?” The task was for students to think about their respective schools as researchers. Students were to look at their code of conduct, classroom rules and policies, or any observed inconsistencies in discipline practices between different students in regards to race or other identifying factors. Below are the tools that helped us with this process:
- YTAC-D Walkthrough/ Observation Protocol (Appendix D) This tool is to help determine school culture through school walkthroughs and observations. Please feel free to adjust this tool to fit your own school climate. It is meant for youth and adults to use together to determine school culture and the student experience. With this tool you can begin critical conversations with youth and adult stakeholders about what contributes to/and or disrupt an equitable school environment. We hope the conversations will lead to action and necessary policy changes.
- The School Discipline Process (Appendix E) The purpose of this tool is to articulate your school school discipline process by considering the path taken by a student who is exhibiting behavior problems/needs in a classroom.
After using these tools, youth shared their observations of noticeable outcomes of disproportionality, such as the lack of racial diversity among classmates and teachers, or the presence of metal detectors and high number of security guards in predominantly Black and Brown schools.
Below are examples of findings for this research activity. Each student response is from a different school:
“We are majority Black and Latino, however, suspension rate is extremely high. In addition to the zero tolerance policy, our students are not being reasoned with. Instead they are being punished more harshly than what they should be. Only approximately 10 of 98 students are taking AP Calc (our only AP class). We also only have two honors classes, one being when you are already a senior.”
“In a school with a majority white staff, most students feel misrepresented and misunderstood. Usually this is due to the teachers not taking into account students struggles (regarding race, family or financial instability etc)”
“Demographic is majority white and Asian, thus students who are unequally represented feel isolated and even attacked sometimes. Our staff and teachers are majority white as well.”
Not all responses were negative--another high school noted positive practices such as restorative circles and welcoming staff.

Although we considered this step in the YPAR process preliminary research, this is important data and depending on how much time you have, you can flesh it out widely. For instance, although we ran out of time, students could have even gone back to collect more information about how their schools function in regards to disproportionality. Despite our lack of time, this was an important activity in prompting students to think about how disproportionality plays out in their school through their lens.


4. Pose a question
After gathering an abundance of information on the context and culture of our individual schools, students were ready to go even deeper about exploring disproportionality. They wanted to talk to their peers and understand how they experienced disproportionality. The question we posed as our main research question was, “how do NYC youth experience disproportionality?” We knew the numbers concerning disproportionality and now wanted to focus our efforts on contextualizing and humanizing our data by directly asking youth and school adults about their embodied school experiences.
5. Identify what tools are needed to answer the question:
Our tools shifted a bit from year to year. However, we were consistent in using qualitative methods (human centered research) to fully understand the human experience under the guise of disproportionality. We decided to make and distribute an open ended survey as the tool to help us answer our question. You may also decide to do focus groups or individual interviews, depending on the capacity of your group and context. The open ended survey (described below) worked for us.
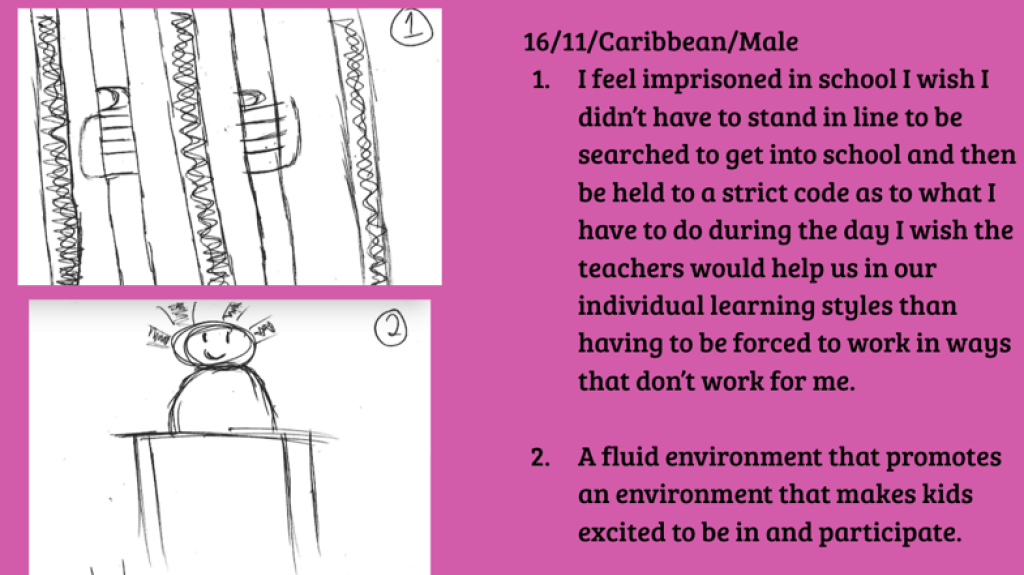
- Qualitative Data Collection Survey (Appendix H) Each year we sent out a survey to understand the embodied school experience of young people (and in year 2, adults as well). We gave participants the option to respond through images (drawing a picture) or through written response to the prompt to gather a wider range of expression to make meaning of their experiences.
Before launching our data collection, during one of our YTAC-D meetings, we piloted the activity with our internal group. Everyone completed the activity and talked through their drawings. From there, the students were given direction to conduct these same surveys with their classmates. Piloting the survey within the group helped youth understand the process of completing the survey and could field questions from participants.
6. Data collection (Distributing the surveys):
After we made the tool we took the survey back to our respective schools. Students worked with the principal and staff liaison for the distribution plan. In our second year, because we had been in closer communication with school leadership, principals and staff were mostly supportive. Sometimes schools were resistant to the survey, but most students found ways to distribute the survey to their peers and school adults.
The adult relationship becomes invaluable when youth are met with resistance from their school administration. Adult partners can support students in navigating these hurdles in order to facilitate the data collection. When youth have trouble distributing surveys or other information, adult partners can intervene by leveraging their power to help with the process. We understand that some teachers may also be vulnerable to pushback from school leadership, yet we encourage teachers to use their privilege when they can and build with a greater collective of educators to support youth. Data collection is crucial to illuminating a problem and understanding the student experience. If school leadership believes that their school is absent from issues of disproportionality, then they should not be afraid of this type of data collection. Let the data speak.
After conducting the qualitative survey with participants, the group came back together to reflect on our data collection process before analyzing the data. The YTAC-D youth researchers who were successful with the survey were able to take class time from their teacher for their fellow students to participate. Other YTAC-D students handed out the survey to their peers during lunch or on their free time. YTAC-D members reported that some of their peers were interested and eager to take the survey, noting that they rarely have the opportunity to discuss this topic. Other YTAC-D members said that their classmates felt uncomfortable with it or that they weren’t interested in taking it because “they didn’t have Black and Brown kids at their schools.”
For us, in the end, some students collected over 100 surveys from their peers. Others collected a classroom size of surveys. For year 2, we collected almost 500 surveys total. We had a large task ahead of analyzing the data. Below are some tools that helped us make meaning of our completed surveys.
The 500+ responses we collected offered deeply personal reflections on disproportionality; students drew images of themselves behind prison bars, of their classmates yelling slurs, of discrimination from their teachers, etc. They wrote about their ideal school; a school that supported them, a school where they saw themselves in the teachers and curriculum, a school that truly listened to their voices, etc. The surveys brought the lived experiences of students into our study of disproportionality, adding depth to our work. Furthermore, the process of bringing the surveys into schools and classrooms validated students' experiences of disproportionality and disrupted the silence that had long accompanied them. Students who responded to the surveys were empowered to take ownership of their experiences, acknowledge any injustices they may have faced, and imagine what their ideal school could be. The focus on student voice and youth leadership made YTAC-D a truly meaningful experience not just for me or my peers in the group, but for all the students that our work touched as well.
7. Collective Data Analysis
After the data collection comes the tedious and important task of analyzing the data. During this process we made sense of the data through a systematic and iterative process to draw conclusions. This process takes several weeks as it is necessary to be thorough when establishing themes, outliers and other interesting data points.
- Data Dive (Appendix I) The data dive worksheet and activity were useful in helping us pick apart surveys and help us unpack the data. In our case, we separated the surveys into boroughs[2] and then within the boroughs we divided youth and adult surveys by race and gender.
- Data Dive Part 2 (Appendix J) The second round of our qualitative data analysis consisted of a grounded analysis, where we carefully looked at surveys and identified what themes we found. We discussed what was interesting about the images, what words or phrases stood out to us in the written explanations and what was similar or different across various categories such as race, gender, school, or borough. We repeated this activity roughly three times to help us draw more conclusive results.

For our collective analysis, we used grounded theory (Glauser & Strauss, 1967), meaning that we applied inductive analysis to our data to group emerging themes, and from there generated theory (figure 4). Together, we split up the surveys into different piles. Then the whole group split up into smaller groups of 4-5 people. YTAC-D adults and youth made up the groups. We each took a pile, and together, read through the surveys. We began to categorize responses that were similar to create themes. We highlighted significant quotes from the surveys on sticky notes that we would share later with the group for feedback. Next, in our groups, we began to talk to each other about what we were noticing in the data. Lastly, we decided on themes identified from their specific pile. From there, they put their findings on a large poster-sized post-it note. This was an iterative process and we completed several rounds to get many eyes and ideas on the different sets of data before drawing conclusions.

Each group put their poster on the wall that compiled their themes and what they found complicated or interesting about the data, as well as significant quotes they chose from the student responses. When all the posters were up we did a gallery walk, where we looked at each others posters. They looked for differences and connections across posters to form themes. When the gallery walk was over, students shared out about their own poster, and then other students shared out what themes and outliers they noticed.
In our next session, we came back to the data and looked at the data from the lens of race, gender, and safety.
8. Draw Conclusions (Findings)
Once we felt that we had exhausted our data analysis we grouped our themes together with their corresponding evidence and drew findings. Below is an excerpt of findings from our year 2 study.
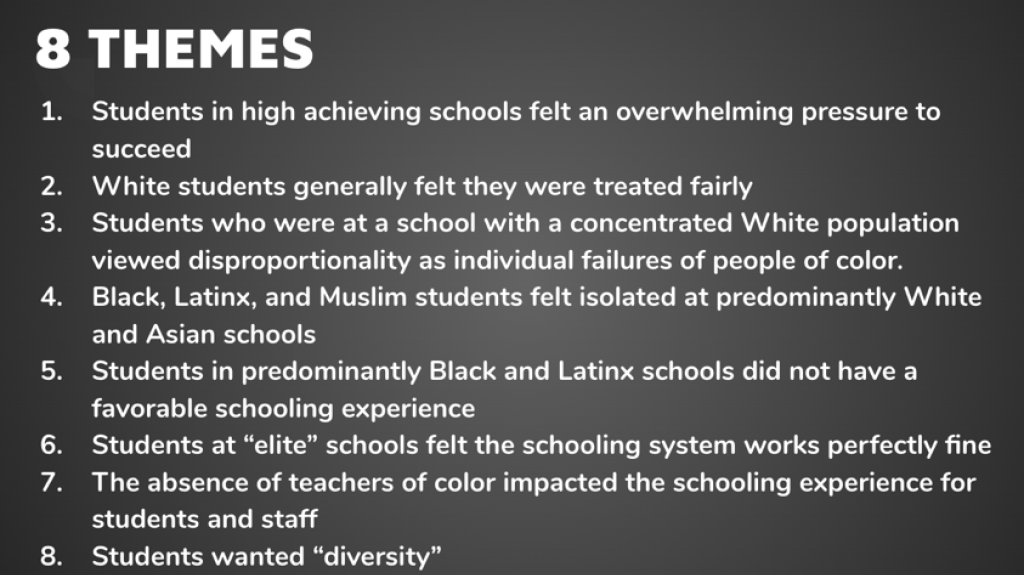
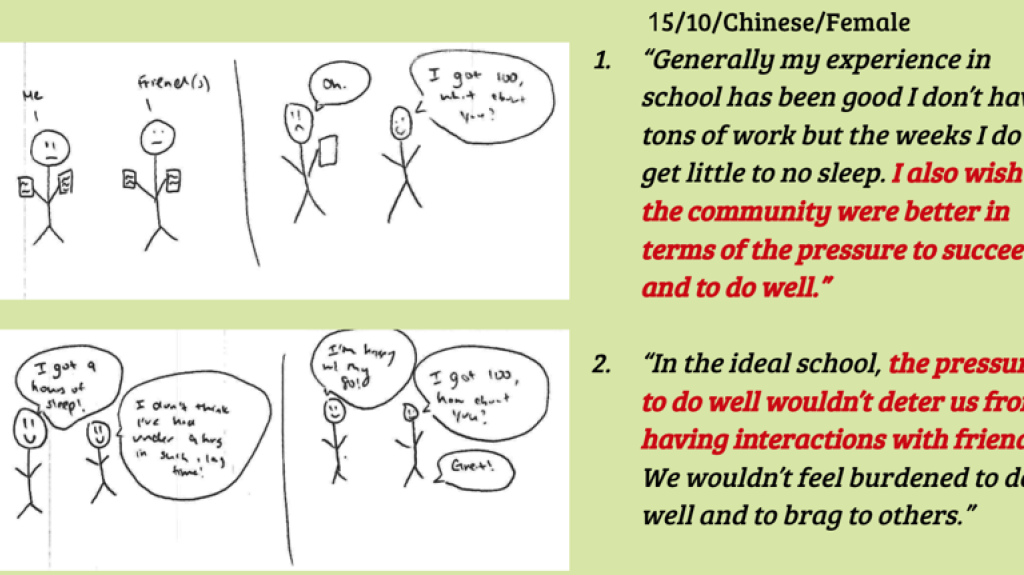
Evidence to support theme 1:
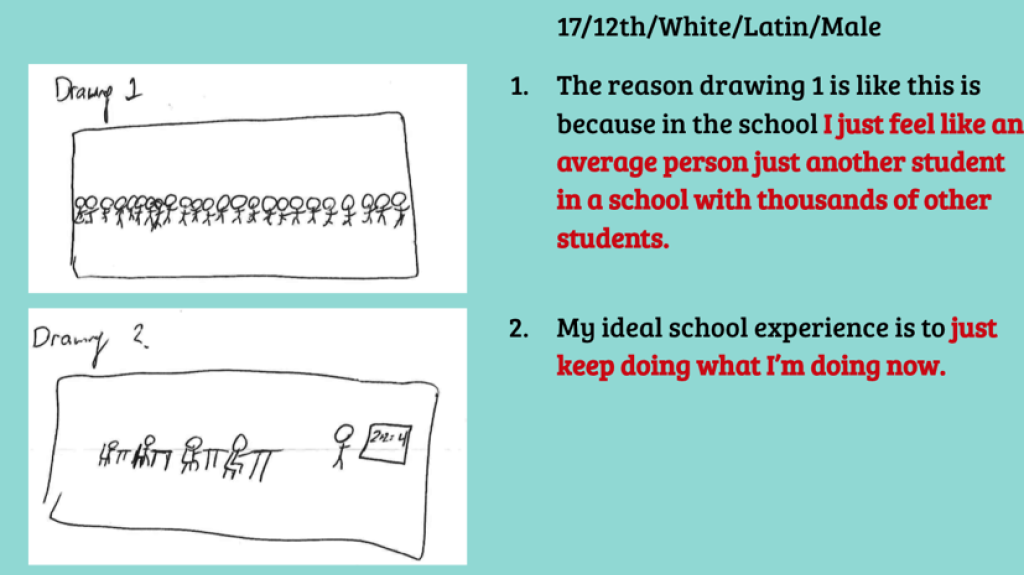
Evidence to support theme 2:
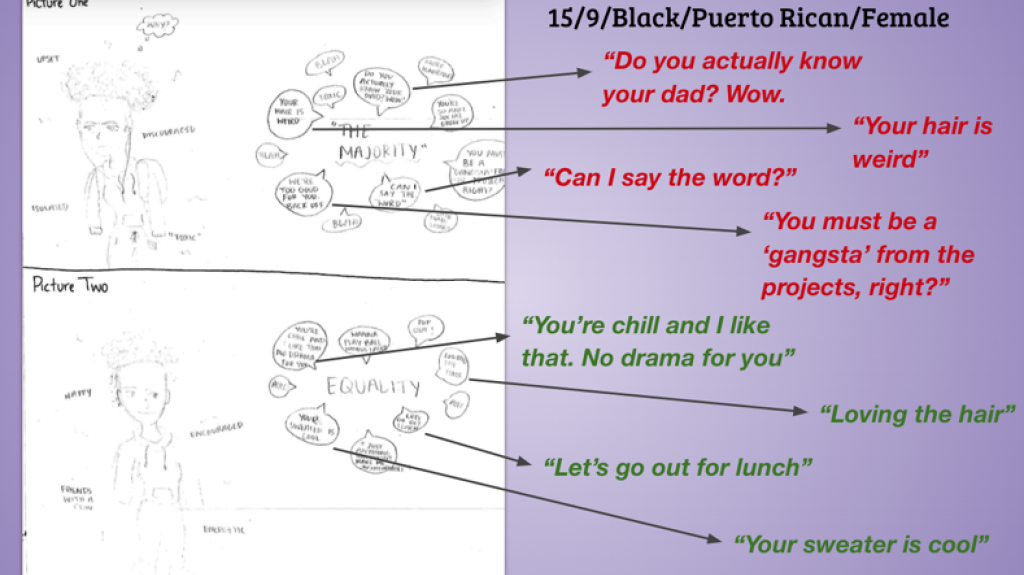
Evidence to support theme 4:
Evidence to support theme 5:
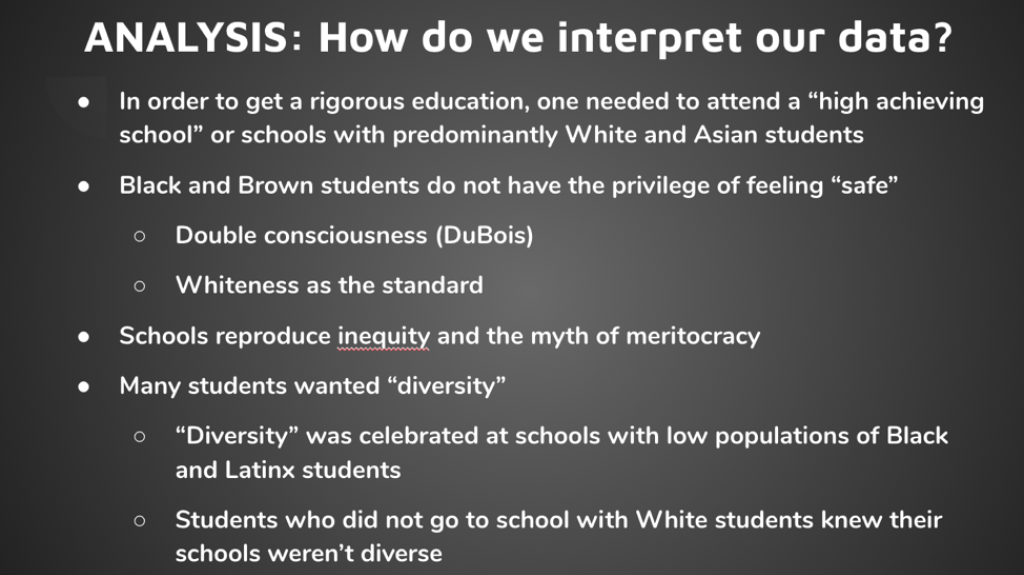
The slide above represents how the youth interpreted their findings. In other words, what meaning did they make of their conclusions? As shown above, all students viewed that success in schools was racialized, meaning that high achieving schools were synonymous with a predominately white and Asian student population. On the other hand, Black and Brown students did not have the privilege of feeling safe whether they were in the minority in a predominantly white and Asian school or the majority in a predominantly Black and Brown school. Black and Brown students received microaggressions from their peers and teachers in predominantly White and Asian schools. Additionally, BIPOC students in Black and Brown schools felt unsafe by heavy police presence and felt silenced by teachers and other school adults. By the response of students who were in “high achieving schools” they believed that they were in their rightful position and that students in “low achieving schools” (read Black and Brown students) just “did not work hard enough.” Finally, “diversity” was a desired quality in schools yet, despite the schools with low students of Black and Latinx descent, their minimal presence was celebrated instead of recognizing a glaring problem of segregation.
Due to the overwhelming amount of data, time constraints, and the iterative nature of data analysis, it is improbable that we caught every theme or considered all pieces of the data. We acknowledge that there were outliers that we did not get a chance to negotiate and address. However, this was a powerful process for our youth. Not only did it develop key academic skills (reading, writing, high level analysis, research), many students commented on feeling that the findings were affirming to student experiences. This was a transformative process that gave credibility to student voice, allowing them to articulate what they already knew that was grounded in research.
Although we finished our project with powerful conclusions, this process was not easy. It took hours of work and additional sessions to complete. It took teamwork and adult- youth solidarity. We spent many Friday nights breaking down data and having tough conversations for hours. But we believe we are better because of it. The work we put in was the work we got out. Equity work takes time, effort, dedication and commitment. This cannot be replaced by a one day workshop or one “courageous conversation.” It is a lifelong commitment. And the work doesn’t stop at the end of the project.
The next section offers suggestions on how to continue this work after completing each step.
YTAC-D was a space where we learned to name and identify the root causes and underlying systems that created the educational experiences we were having. It allowed for analyzing and dissecting the historical, systemic, local, and national conversations around the education system- specifically in disproportionality and segregation in race, socioeconomic status, and disability. These conversations then allowed for honesty and vulnerability in our own personal experiences. Beyond these impactful conversations, we also did YPAR at our own schools with an arts-based approach of asking students how they felt in their schools and not only asking about quantifiable data. Our quantitative data came from demographic and disciplinary records provided by our schools’ administration. We also analyzed the same data for the city, state, and nation. Our findings and conclusions led to making policy recommendations and proposals as well as joining conversations with education leaders.
Overall, the process of learning about the foundational context for personal experiences, researching the manifestations of systemic issues, and then presenting them in policy proposals or in key conversations helped us to begin to humanize data rather than allow it to be one-dimensional. This work was important because it allowed us to turnkey our findings and understandings back to our respective communities and also to broader conversations in the educational policy sphere.


[1] Individualized Education Plan/ Special Education students
[2] There are five boroughs in New York City (Bronx, Brooklyn, Manhattan, Queens, and Staten Island)