

A3SR Visualization Competition First Place Winner, Mitsuki Irihara
Every year, PRIISM runs a student visualization competition to display and highlight the talents of the A3SR graduate students.
The winning visualization, submitted by A3SR student Mitsuki Irihara is titled "Spatial Distribution of Harassment Incidents against Asians and Pacific Islanders: Pre-, During, and Post-COVID-19 Pandemic" shows how the COVID-19 pandemic affected the distribution of harassment against Asians and Pacific Islanders (API)? COVID-19 has fostered discrimination and prejudice against the API community, and its members have been greatly affected. However, there are not yet many resources that show the impact quantitatively. Therefore, by utilizing the NYPD Complaint Data Historic dataset, Mitsuki created a heat map showing the spatial distribution of harassment incidents against API individuals in New York City. This not only shows a general trend of harassment incidents occurring in Manhattan and Queens but also reveals that harassment actually spread throughout the city amidst COVID-19.
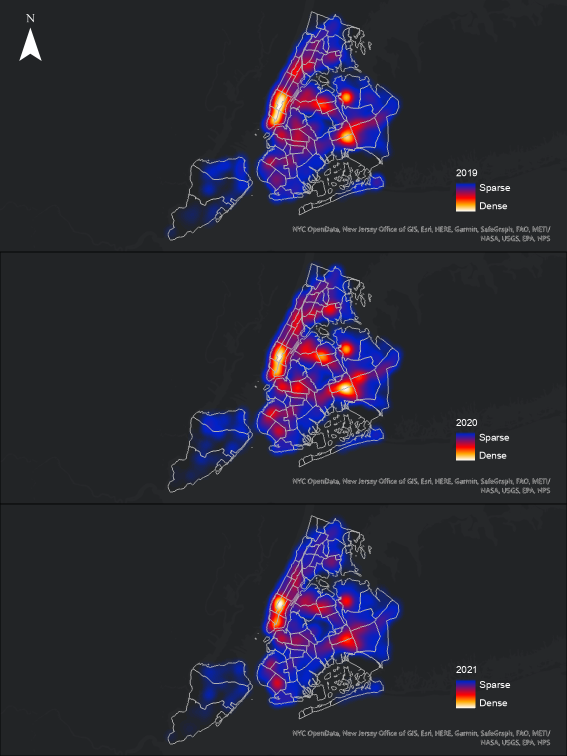
Source data: NYC OpenData, New Jersey Office of GIS, Eri, HERE, Garmin, SafeGraph, FAO, METI/NASA, USGS, EPA, NPS